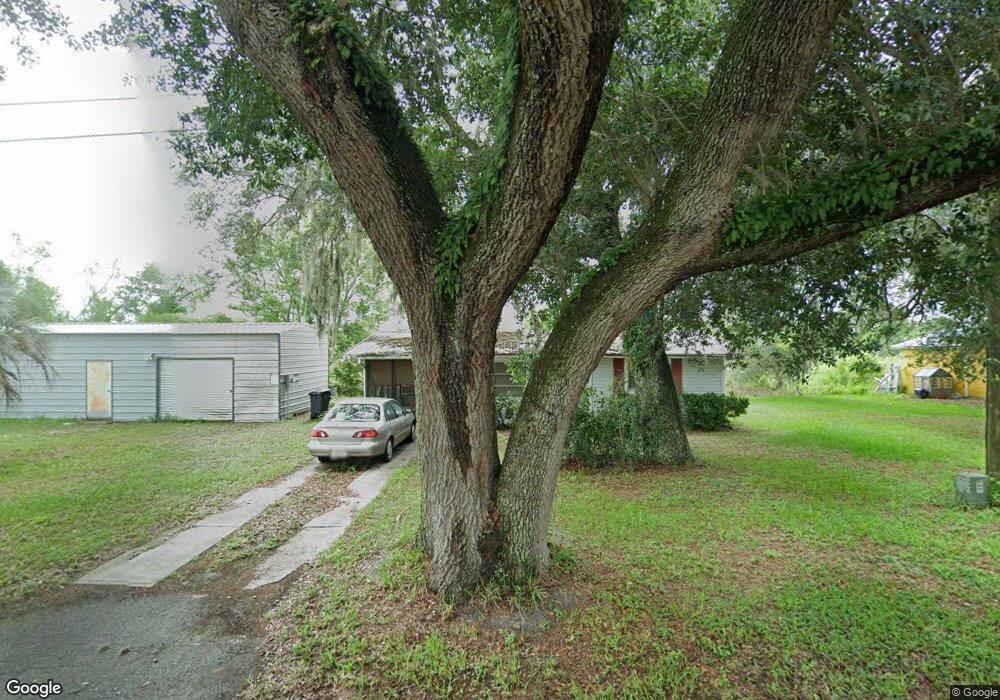
929 S Shad Terrace Inverness, FL 34450
Estimated Value: $150,000 - $199,000
2
Beds
1
Bath
950
Sq Ft
$179/Sq Ft
Est. Value
About This Home
This home is located at 929 S Shad Terrace, Inverness, FL 34450 and is currently estimated at $169,846, approximately $178 per square foot. 929 S Shad Terrace is a home located in Citrus County with nearby schools including Inverness Primary School, Inverness Middle School, and Citrus High School.
Ownership History
Date
Name
Owned For
Owner Type
Purchase Details
Closed on
Oct 30, 2024
Sold by
Scyocurka-Avery Grace E
Bought by
Shaw Francis L and Shaw Nancy L
Current Estimated Value
Purchase Details
Closed on
Mar 1, 2010
Bought by
Avery Grace E Scyocurka
Purchase Details
Closed on
May 25, 2007
Sold by
Drozda Irene M and Rosalie C Miller Revocable Tru
Bought by
Avery Mark E and Scyocurka Avery Grace E
Purchase Details
Closed on
May 1, 2006
Bought by
Avery Grace E Scyocurka
Purchase Details
Closed on
Nov 30, 2005
Sold by
Miller Rosalie C
Bought by
Miller Rosalie C and Rosalie C Miller Revocable Trust
Purchase Details
Closed on
Nov 1, 2005
Bought by
Avery Grace E Scyocurka
Purchase Details
Closed on
Nov 1, 1977
Bought by
Avery Grace E Scyocurka
Purchase Details
Closed on
Jun 1, 1977
Bought by
Avery Grace E Scyocurka
Create a Home Valuation Report for This Property
The Home Valuation Report is an in-depth analysis detailing your home's value as well as a comparison with similar homes in the area
Home Values in the Area
Average Home Value in this Area
Purchase History
| Date | Buyer | Sale Price | Title Company |
|---|---|---|---|
| Shaw Francis L | $150,000 | Citrus Title | |
| Avery Grace E Scyocurka | $100 | -- | |
| Avery Mark E | $74,500 | First American Title Ins Co | |
| Avery Grace E Scyocurka | $100 | -- | |
| Miller Rosalie C | -- | -- | |
| Avery Grace E Scyocurka | $100 | -- | |
| Avery Grace E Scyocurka | $1,500 | -- | |
| Avery Grace E Scyocurka | $30,000 | -- |
Source: Public Records
Tax History Compared to Growth
Tax History
| Year | Tax Paid | Tax Assessment Tax Assessment Total Assessment is a certain percentage of the fair market value that is determined by local assessors to be the total taxable value of land and additions on the property. | Land | Improvement |
|---|---|---|---|---|
| 2024 | $1,594 | $119,670 | $16,320 | $103,350 |
| 2023 | $1,594 | $118,380 | $16,320 | $102,060 |
| 2022 | $1,331 | $90,590 | $7,620 | $82,970 |
| 2021 | $1,166 | $73,440 | $7,620 | $65,820 |
| 2020 | $1,041 | $68,350 | $7,620 | $60,730 |
| 2019 | $1,038 | $73,418 | $13,860 | $59,558 |
| 2018 | $934 | $64,386 | $13,090 | $51,296 |
| 2017 | $795 | $46,450 | $7,920 | $38,530 |
| 2016 | $861 | $48,750 | $7,920 | $40,830 |
| 2015 | $858 | $48,052 | $7,920 | $40,132 |
| 2014 | $807 | $43,020 | $7,843 | $35,177 |
Source: Public Records
Map
Nearby Homes
- 10120 E Gulf To Lake Hwy
- 10025 E Perch Ct
- 10134 E Bass Cir
- 10160 E Bass Cir
- 9936 E Perch Ct
- 10416 E Joy Ln
- 10330 E Pike Dr
- 10262 E Pike Dr
- 10319 E Pike Dr
- 10342 & 10338 E Pike Dr
- 10501 E Patience Ln
- 9711 E Monica Ct
- 9680 E Gospel Island Rd
- 809 S Honey Way
- 3742 S Pelican Ave
- 9335 E Beech Cir
- 9616 E Gospel Island Rd
- 9532 E Peachtree Ln
- 9113 E Royal Palm Dr
- 76 S Heron Creek Loop
- 937 S Shad Terrace
- 940 S Shad Terrace
- 909 & 911 S Shad Terrace
- 912 S Shad Terrace
- 1009 S Shad Terrace
- 891 S Shad Terrace
- 905 S Shad Terrace
- 891 & 905 S Shad Terrace
- 908 S Shad Terrace
- 10119 E Perch Ct
- 10207 E Pike Dr
- 10118 E Perch Ct
- 1029 S Shad Terrace
- 10113 E Bass Cir
- 10116 E Gulf To Lake Hwy
- 10040 E Bluegill Ct
- 10111 E Bass Cir
- 1028 S Shad Terrace
- 10041 E Bluegill Ct
- 10108 E Gulf To Lake Hwy