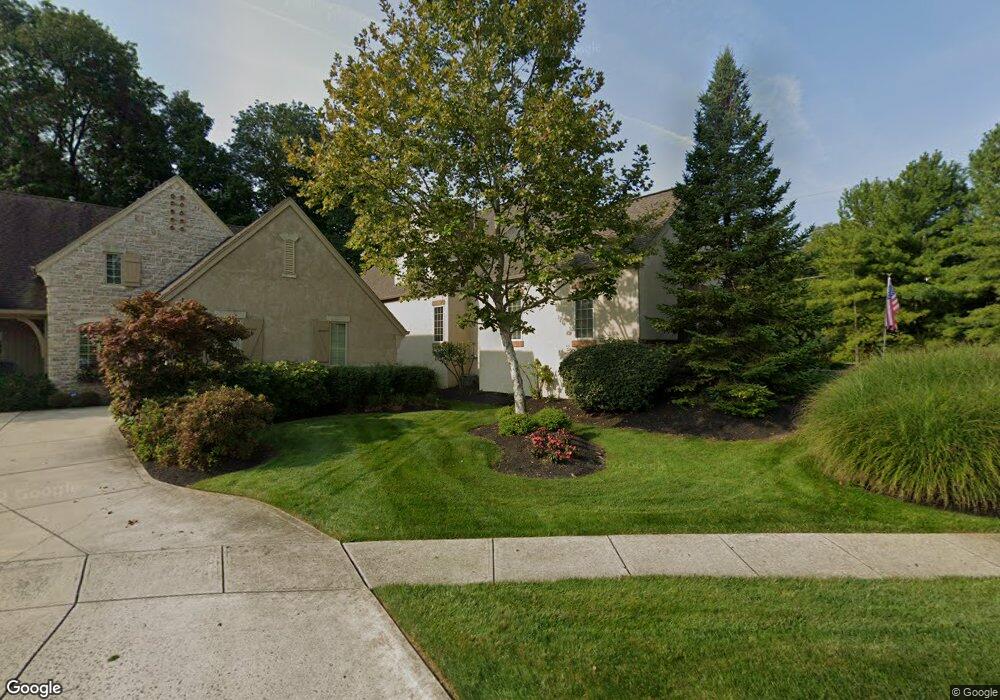
929 Thomas Joseph Ln Columbus, OH 43235
Estimated Value: $711,440 - $944,000
3
Beds
4
Baths
2,771
Sq Ft
$281/Sq Ft
Est. Value
About This Home
This home is located at 929 Thomas Joseph Ln, Columbus, OH 43235 and is currently estimated at $778,860, approximately $281 per square foot. 929 Thomas Joseph Ln is a home located in Franklin County with nearby schools including Bluffsview Elementary School, McCord Middle School, and Worthington Kilbourne High School.
Ownership History
Date
Name
Owned For
Owner Type
Purchase Details
Closed on
Oct 29, 2010
Sold by
Agosta Sherri L and Julia A Hansley Trust
Bought by
Irwin Karen M and Irwin Terry L
Current Estimated Value
Home Financials for this Owner
Home Financials are based on the most recent Mortgage that was taken out on this home.
Original Mortgage
$250,000
Interest Rate
3.72%
Mortgage Type
New Conventional
Purchase Details
Closed on
Jul 22, 2008
Sold by
Hansley Julia A
Bought by
Hansley Julia A and Julia A Hansley Trust
Purchase Details
Closed on
Nov 17, 2006
Sold by
Newbury Homes Inc
Bought by
Hansley Julia A and Greco Joseph
Home Financials for this Owner
Home Financials are based on the most recent Mortgage that was taken out on this home.
Original Mortgage
$416,999
Interest Rate
6.41%
Mortgage Type
Purchase Money Mortgage
Create a Home Valuation Report for This Property
The Home Valuation Report is an in-depth analysis detailing your home's value as well as a comparison with similar homes in the area
Home Values in the Area
Average Home Value in this Area
Purchase History
| Date | Buyer | Sale Price | Title Company |
|---|---|---|---|
| Irwin Karen M | $410,000 | Title First | |
| Hansley Julia A | -- | Attorney | |
| Hansley Julia A | $532,000 | Hummel Titl |
Source: Public Records
Mortgage History
| Date | Status | Borrower | Loan Amount |
|---|---|---|---|
| Previous Owner | Irwin Karen M | $250,000 | |
| Previous Owner | Hansley Julia A | $416,999 |
Source: Public Records
Tax History Compared to Growth
Tax History
| Year | Tax Paid | Tax Assessment Tax Assessment Total Assessment is a certain percentage of the fair market value that is determined by local assessors to be the total taxable value of land and additions on the property. | Land | Improvement |
|---|---|---|---|---|
| 2024 | $14,378 | $234,190 | $58,800 | $175,390 |
| 2023 | $13,749 | $234,185 | $58,800 | $175,385 |
| 2022 | $17,706 | $239,300 | $36,230 | $203,070 |
| 2021 | $16,005 | $234,470 | $36,230 | $198,240 |
| 2020 | $15,499 | $235,730 | $36,230 | $199,500 |
| 2019 | $14,937 | $205,000 | $31,500 | $173,500 |
| 2018 | $14,130 | $205,000 | $31,500 | $173,500 |
| 2017 | $13,587 | $205,000 | $31,500 | $173,500 |
| 2016 | $13,789 | $194,220 | $37,350 | $156,870 |
| 2015 | $13,791 | $194,220 | $37,350 | $156,870 |
| 2014 | $13,787 | $194,220 | $37,350 | $156,870 |
| 2013 | $6,476 | $183,365 | $33,950 | $149,415 |
Source: Public Records
Map
Nearby Homes
- 7522 Acela St
- 1101 Bluffway Dr
- 1109 Bluffway Dr
- 1041 Rosebank Dr
- 1232 Lochcarren Ct
- 1380 Tiehack Ct
- 7187 Lorine Ct
- 7164 Durness Place
- 6908 Perry Dr
- 7347 Fall Creek Ln Unit J
- 1620 Park Row Dr Unit A
- 445 Thackeray Ave
- 865 Colony Way
- 210 Saint Antoine St Unit 25D
- 203 Saint Pierre St
- 1678 Park Row Dr Unit B
- 941 Clubview Blvd S
- 7383 Coldstream Dr
- 1672 Rushing Way
- 1721 Worthington Run Dr Unit 1721-1731
- 921 Thomas Joseph Ln
- 913 Thomas Joseph Ln
- 7044 Linworth Rd
- 949 Adin Trail
- 930 Thomas Joseph Ln
- 946 Cross Country Dr
- 905 Thomas Joseph Ln
- 7034 Linworth Rd
- 906 Thomas Joseph Ln
- 7085 Linworth Rd
- 7031 Brafferton Place
- 897 Thomas Joseph Ln
- 950 Adin Trail
- 967 Adin Trail
- 954 Cross Country Dr
- 7109 James Emmett Place
- 898 Thomas Joseph Ln
- 7020 Linworth Rd
- 1 Adin Trail
- 0 Adin Trail