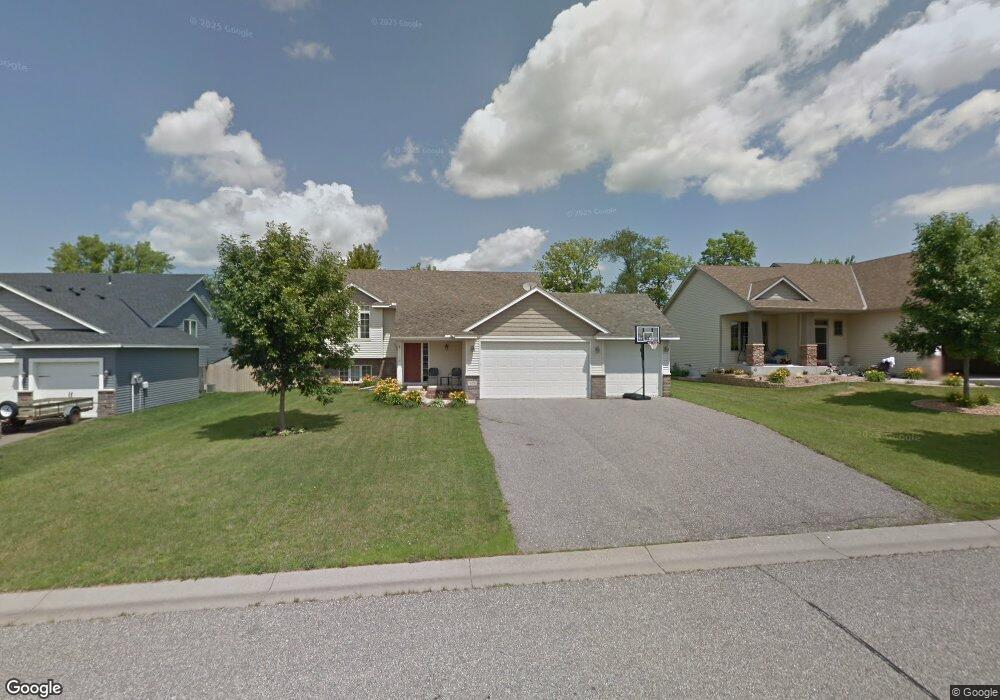
929 Trellis St Jordan, MN 55352
Estimated Value: $358,868 - $405,000
4
Beds
3
Baths
1,236
Sq Ft
$307/Sq Ft
Est. Value
About This Home
This home is located at 929 Trellis St, Jordan, MN 55352 and is currently estimated at $379,217, approximately $306 per square foot. 929 Trellis St is a home located in Scott County with nearby schools including Jordan Elementary School, Hoboken Middle School, and Jordan Middle School.
Ownership History
Date
Name
Owned For
Owner Type
Purchase Details
Closed on
Jun 29, 2017
Sold by
Unger Keith J and Unger Anna Marie R
Bought by
Penney Scott C and Penney Hollie M
Current Estimated Value
Home Financials for this Owner
Home Financials are based on the most recent Mortgage that was taken out on this home.
Original Mortgage
$244,400
Outstanding Balance
$203,777
Interest Rate
4.02%
Mortgage Type
New Conventional
Estimated Equity
$175,440
Purchase Details
Closed on
Oct 31, 2007
Sold by
Lakeland Construction Finance Llc
Bought by
Unger Keith J
Purchase Details
Closed on
Sep 23, 2004
Sold by
Tollefson Development Inc
Bought by
All Quality Builders Inc
Create a Home Valuation Report for This Property
The Home Valuation Report is an in-depth analysis detailing your home's value as well as a comparison with similar homes in the area
Home Values in the Area
Average Home Value in this Area
Purchase History
| Date | Buyer | Sale Price | Title Company |
|---|---|---|---|
| Penney Scott C | $260,000 | None Available | |
| Unger Keith J | $221,000 | -- | |
| All Quality Builders Inc | $85,900 | -- |
Source: Public Records
Mortgage History
| Date | Status | Borrower | Loan Amount |
|---|---|---|---|
| Open | Penney Scott C | $244,400 |
Source: Public Records
Tax History Compared to Growth
Tax History
| Year | Tax Paid | Tax Assessment Tax Assessment Total Assessment is a certain percentage of the fair market value that is determined by local assessors to be the total taxable value of land and additions on the property. | Land | Improvement |
|---|---|---|---|---|
| 2025 | $4,278 | $335,800 | $85,900 | $249,900 |
| 2024 | $4,150 | $348,800 | $88,500 | $260,300 |
| 2023 | $3,950 | $324,800 | $81,200 | $243,600 |
| 2022 | $3,772 | $333,700 | $85,500 | $248,200 |
| 2021 | $3,676 | $266,500 | $69,000 | $197,500 |
| 2020 | $3,812 | $259,200 | $66,600 | $192,600 |
| 2019 | $3,668 | $261,100 | $64,800 | $196,300 |
| 2018 | $3,258 | $0 | $0 | $0 |
| 2016 | $3,306 | $0 | $0 | $0 |
| 2014 | -- | $0 | $0 | $0 |
Source: Public Records
Map
Nearby Homes
- 824 Bridle Creek Ln
- 1093 Pinehurst Ln
- 713 Prospect Point Rd
- 952 Stone Creek Dr
- 960 Stone Creek Dr
- 968 Stone Creek Dr
- 969 Stone Creek Dr
- 976 Stone Creek Dr
- 977 Stone Creek Dr
- 984 Stone Creek Dr
- 985 Stone Creek Dr
- 993 Stone Creek Dr
- The Louisville Plan at Bridle Creek
- 1083 Shoreview Dr
- The Pine Plan at Bridle Creek
- The Elm Plan at Bridle Creek
- The Elder Plan at Bridle Creek
- The Eldorado Plan at Bridle Creek
- 961 Huntington Way
- 963 Huntington Way
- 925 Trellis St
- 933 Trellis St
- 924 Firethorne Trail
- 921 Trellis St
- 937 Trellis St
- 928 Firethorne Trail
- 920 Firethorne Trail
- 932 Trellis St
- 932 Firethorne Trail
- 1101 Rose Ct
- 917 Trellis St
- 941 Trellis St
- 928 Trellis St
- 916 Firethorne Trail
- 936 Firethorne Trail
- 1105 Rose Ct
- 936 Trellis St
- 940 Trellis St
- 913 Trellis St
- 945 Trellis St