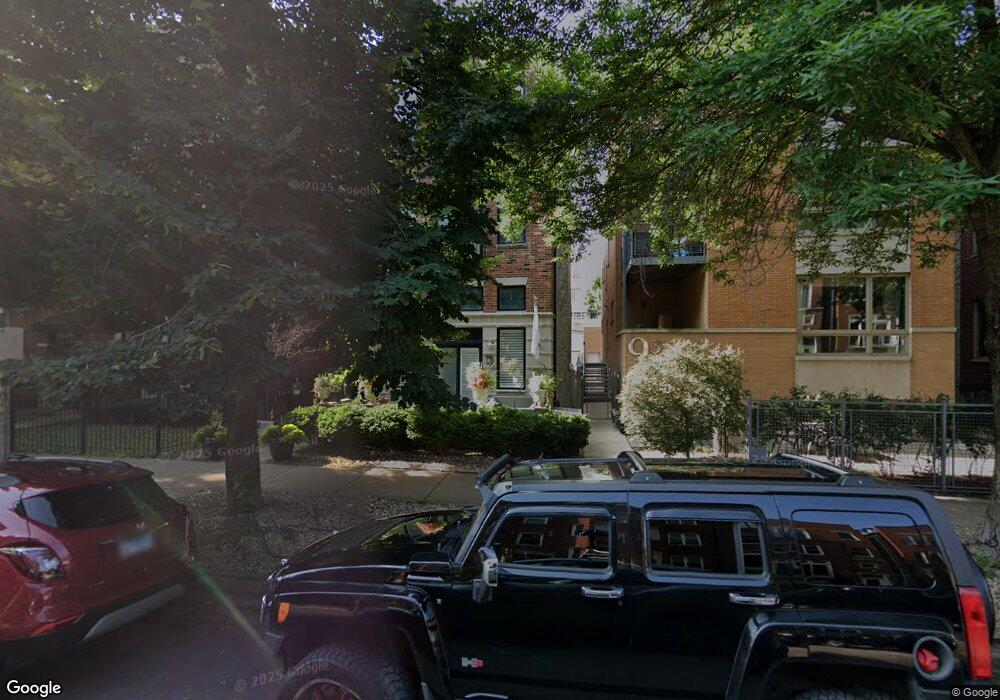
929 W George St Unit 2 Chicago, IL 60657
Lakeview East NeighborhoodEstimated Value: $631,000 - $742,000
2
Beds
2
Baths
1,500
Sq Ft
$453/Sq Ft
Est. Value
About This Home
This home is located at 929 W George St Unit 2, Chicago, IL 60657 and is currently estimated at $678,819, approximately $452 per square foot. 929 W George St Unit 2 is a home located in Cook County with nearby schools including Harriet Tubman Elementary School, Lincoln Park High School, and Alphonsus Academy & Center For The Arts.
Ownership History
Date
Name
Owned For
Owner Type
Purchase Details
Closed on
Aug 4, 2008
Sold by
Nelson Katherine A and Milton Richard
Bought by
Hoffman Tracy L
Current Estimated Value
Home Financials for this Owner
Home Financials are based on the most recent Mortgage that was taken out on this home.
Original Mortgage
$344,800
Outstanding Balance
$228,292
Interest Rate
6.51%
Mortgage Type
Unknown
Estimated Equity
$450,527
Purchase Details
Closed on
Jul 26, 2003
Sold by
Nichols Scott
Bought by
Nelson Katherine A and Milton Richard
Home Financials for this Owner
Home Financials are based on the most recent Mortgage that was taken out on this home.
Original Mortgage
$300,800
Interest Rate
4.25%
Mortgage Type
Unknown
Purchase Details
Closed on
Apr 16, 2001
Sold by
929 West George Llc
Bought by
Nichols Scott
Create a Home Valuation Report for This Property
The Home Valuation Report is an in-depth analysis detailing your home's value as well as a comparison with similar homes in the area
Home Values in the Area
Average Home Value in this Area
Purchase History
| Date | Buyer | Sale Price | Title Company |
|---|---|---|---|
| Hoffman Tracy L | $431,000 | Multiple | |
| Nelson Katherine A | $376,000 | Multiple | |
| Nichols Scott | $370,000 | -- |
Source: Public Records
Mortgage History
| Date | Status | Borrower | Loan Amount |
|---|---|---|---|
| Open | Hoffman Tracy L | $344,800 | |
| Previous Owner | Nelson Katherine A | $300,800 |
Source: Public Records
Tax History Compared to Growth
Tax History
| Year | Tax Paid | Tax Assessment Tax Assessment Total Assessment is a certain percentage of the fair market value that is determined by local assessors to be the total taxable value of land and additions on the property. | Land | Improvement |
|---|---|---|---|---|
| 2024 | $10,794 | $56,361 | $19,732 | $36,629 |
| 2023 | $10,501 | $54,475 | $19,845 | $34,630 |
| 2022 | $10,501 | $54,475 | $19,845 | $34,630 |
| 2021 | $10,285 | $54,474 | $19,845 | $34,629 |
| 2020 | $8,791 | $42,563 | $7,711 | $34,852 |
| 2019 | $8,601 | $46,239 | $7,711 | $38,528 |
| 2018 | $8,455 | $46,239 | $7,711 | $38,528 |
| 2017 | $6,095 | $31,687 | $6,804 | $24,883 |
| 2016 | $5,846 | $31,687 | $6,804 | $24,883 |
| 2015 | $5,326 | $31,687 | $6,804 | $24,883 |
| 2014 | $6,082 | $35,351 | $5,584 | $29,767 |
| 2013 | $5,951 | $35,351 | $5,584 | $29,767 |
Source: Public Records
Map
Nearby Homes
- 2820 N Sheffield Ave Unit 4N
- 2941 N Sheffield Ave Unit 1
- 2729 N Sheffield Ave Unit 1S
- 2741 N Mildred Ave Unit 3S
- 820 W Wolfram St
- 2735 N Kenmore Ave Unit 2S
- 2742 N Kenmore Ave
- 2727 N Kenmore Ave Unit 1
- 2719 N Dayton St
- 2717 N Dayton St
- 2828 N Burling St Unit 208
- 1100 W Wellington Ave
- 3036 N Sheffield Ave Unit 2N
- 3036 N Sheffield Ave Unit 1N
- 3036 N Sheffield Ave Unit 3
- 2703 N Halsted St Unit 2
- 2661 N Dayton St
- 3045 N Kenmore Ave Unit 1R
- 2730 N Lincoln Ave Unit 2
- 2654 N Lincoln Ave
- 929 W George St Unit 1
- 929 W George St Unit 1
- 929 W George St Unit 3
- 933 W George St Unit 3
- 933 W George St
- 933 W George St Unit 1S
- 933 W George St Unit 2
- 927 W George St Unit 2
- 927 W George St Unit 3
- 927 W George St Unit 1
- 937 W George St Unit 2W
- 937 W George St Unit 2E
- 937 W George St Unit 3W
- 937 W George St Unit 1E
- 937 W George St Unit 3E
- 937 W George St Unit 1W
- 915 W George St
- 930 W Wolfram St
- 908 W George St Unit 2908-T3
- 908 W George St Unit 2914-GN