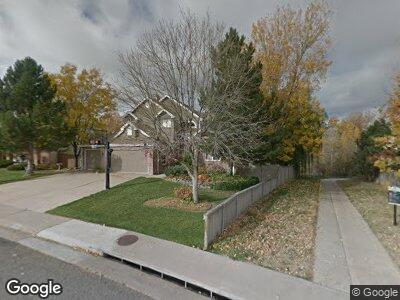
9293 Cornell Cir Highlands Ranch, CO 80130
Eastridge NeighborhoodEstimated Value: $839,000 - $980,000
3
Beds
4
Baths
2,650
Sq Ft
$348/Sq Ft
Est. Value
About This Home
This home is located at 9293 Cornell Cir, Highlands Ranch, CO 80130 and is currently estimated at $921,206, approximately $347 per square foot. 9293 Cornell Cir is a home located in Douglas County with nearby schools including Fox Creek Elementary School, Cresthill Middle School, and Highlands Ranch High School.
Ownership History
Date
Name
Owned For
Owner Type
Purchase Details
Closed on
Jun 27, 2008
Sold by
Barrow Richard
Bought by
Bartlett Kenneth and Bartlett Marilee
Current Estimated Value
Home Financials for this Owner
Home Financials are based on the most recent Mortgage that was taken out on this home.
Original Mortgage
$391,200
Interest Rate
6.36%
Mortgage Type
Unknown
Purchase Details
Closed on
Dec 20, 2006
Sold by
Deutsche Bank National Trust Co
Bought by
Barrow Richard
Home Financials for this Owner
Home Financials are based on the most recent Mortgage that was taken out on this home.
Original Mortgage
$287,790
Interest Rate
6.2%
Mortgage Type
New Conventional
Purchase Details
Closed on
Jun 29, 2006
Sold by
Smith Bradley D and Case Andrea
Bought by
Deutsche Bank National Trust Co
Purchase Details
Closed on
Mar 7, 2000
Sold by
Smith Bradley D
Bought by
Case Andrea
Home Financials for this Owner
Home Financials are based on the most recent Mortgage that was taken out on this home.
Original Mortgage
$248,000
Interest Rate
8.29%
Purchase Details
Closed on
Feb 18, 2000
Sold by
Wynkoop Ronald G and Wynkoop Shari L
Bought by
Smith Bradley D
Home Financials for this Owner
Home Financials are based on the most recent Mortgage that was taken out on this home.
Original Mortgage
$248,000
Interest Rate
8.29%
Purchase Details
Closed on
Apr 22, 1993
Sold by
Wynkoop Ronald G and Wynkoop Shari L Dyke
Bought by
Wynkoop Ronald G and Wynkoop Shari L
Purchase Details
Closed on
Jun 22, 1992
Sold by
Wynkoop Ronald G and Wynkoop Shari L Dyke
Bought by
Wynkoop Ronald G and Wynkoop Shari L
Purchase Details
Closed on
Mar 23, 1992
Sold by
Wynkoop Ronald G and Dyke Shari L
Bought by
Wynkoop Ronald G and Wynkoop Shari L Dyke
Purchase Details
Closed on
Jul 27, 1989
Sold by
Wynkoop Shari L Dyke
Bought by
Wynkoop Ronald G and Dyke Shari L
Purchase Details
Closed on
Jul 17, 1989
Sold by
Richmond Homes Ltd
Bought by
Wynkoop Shari L Dyke
Purchase Details
Closed on
Jun 30, 1989
Sold by
Mdc Land Corp
Bought by
Richmond Homes Ltd
Create a Home Valuation Report for This Property
The Home Valuation Report is an in-depth analysis detailing your home's value as well as a comparison with similar homes in the area
Home Values in the Area
Average Home Value in this Area
Purchase History
| Date | Buyer | Sale Price | Title Company |
|---|---|---|---|
| Bartlett Kenneth | $489,000 | Trinity Title Llc | |
| Barrow Richard | $359,738 | Fahtco | |
| Deutsche Bank National Trust Co | -- | None Available | |
| Case Andrea | $20,000 | -- | |
| Smith Bradley D | $310,000 | Stewart Title | |
| Wynkoop Ronald G | -- | -- | |
| Wynkoop Ronald G | -- | -- | |
| Wynkoop Ronald G | -- | -- | |
| Wynkoop Ronald G | -- | -- | |
| Wynkoop Shari L Dyke | $198,300 | -- | |
| Richmond Homes Ltd | -- | -- |
Source: Public Records
Mortgage History
| Date | Status | Borrower | Loan Amount |
|---|---|---|---|
| Open | Bartlett Kenneth | $577,500 | |
| Closed | Bartlett Kenneth | $500,000 | |
| Closed | Bartlett Kenneth | $88,680 | |
| Closed | Bartlett Kenneth | $496,500 | |
| Closed | Bartlett Kenneth | $64,650 | |
| Closed | Bartlett Kenneth | $493,350 | |
| Closed | Bartlett Kenneth | $83,500 | |
| Closed | Bartlett Kenneth | $411,300 | |
| Closed | Bartlett Kenneth | $412,000 | |
| Closed | Bartlett Kenneth | $50,000 | |
| Closed | Bartlett Kenenth | $417,000 | |
| Closed | Bartlett Kenneth | $24,000 | |
| Closed | Bartlett Kenneth | $395,950 | |
| Closed | Bartlett Kenneth | $391,200 | |
| Previous Owner | Barrow Richard | $287,790 | |
| Previous Owner | Smith Bradley | $50,000 | |
| Previous Owner | Smith Bradley D | $80,000 | |
| Previous Owner | Smith Bradley D | $302,000 | |
| Previous Owner | Smith Bradley D | $50,000 | |
| Previous Owner | Smith Bradley D | $248,000 |
Source: Public Records
Tax History Compared to Growth
Tax History
| Year | Tax Paid | Tax Assessment Tax Assessment Total Assessment is a certain percentage of the fair market value that is determined by local assessors to be the total taxable value of land and additions on the property. | Land | Improvement |
|---|---|---|---|---|
| 2024 | $6,121 | $68,640 | $12,180 | $56,460 |
| 2023 | $6,111 | $68,640 | $12,180 | $56,460 |
| 2022 | $4,289 | $46,950 | $8,250 | $38,700 |
| 2021 | $4,460 | $46,950 | $8,250 | $38,700 |
| 2020 | $4,061 | $43,790 | $8,520 | $35,270 |
| 2019 | $4,076 | $43,790 | $8,520 | $35,270 |
| 2018 | $3,807 | $40,280 | $7,400 | $32,880 |
| 2017 | $3,466 | $40,280 | $7,400 | $32,880 |
| 2016 | $3,529 | $40,250 | $7,650 | $32,600 |
| 2015 | $3,605 | $40,250 | $7,650 | $32,600 |
| 2014 | $3,114 | $32,100 | $5,490 | $26,610 |
Source: Public Records
Map
Nearby Homes
- 6340 Ashburn Ln
- 6033 Trailhead Rd
- 9431 Crossland Way
- 9229 Sugarstone Cir
- 9471 Crossland Way
- 6550 Ashburn Ln
- 6237 Trailhead Rd
- 6307 Monterey Place
- 9265 Buttonhill Ct
- 6415 Trailhead Rd
- 9145 Sugarstone Cir
- 6382 Freeport Dr
- 23 Shetland Ct
- 31 Shetland Ct
- 7114 Mountain Brush Cir
- 7138 Mountain Brush Cir
- 9182 Weeping Willow Ct
- 9161 Weeping Willow Ct
- 6836 Edgewood Way
- 6476 Silver Mesa Dr Unit A
- 9293 Cornell Cir
- 9297 Cornell Cir
- 9289 Cornell Cir
- 9301 Cornell Cir
- 9294 Cornell Cir
- 9285 Cornell Cir
- 9286 Cornell Cir
- 9302 Cornell Cir
- 9305 Cornell Cir
- 9281 Cornell Cir
- 9278 Cornell Cir
- 9306 Cornell Cir
- 9309 Cornell Cir
- 6255 Cornell Ct
- 9277 Cornell Cir
- 6266 Cornell Ct
- 9310 Cornell Cir
- 9274 Cornell Cir
- 9313 Cornell Cir
- 9273 Cornell Cir