K
Landlord's Agent in 2024
Kyle Cumming
Keller Williams Consultants
(614) 595-1908
16 Total Sales
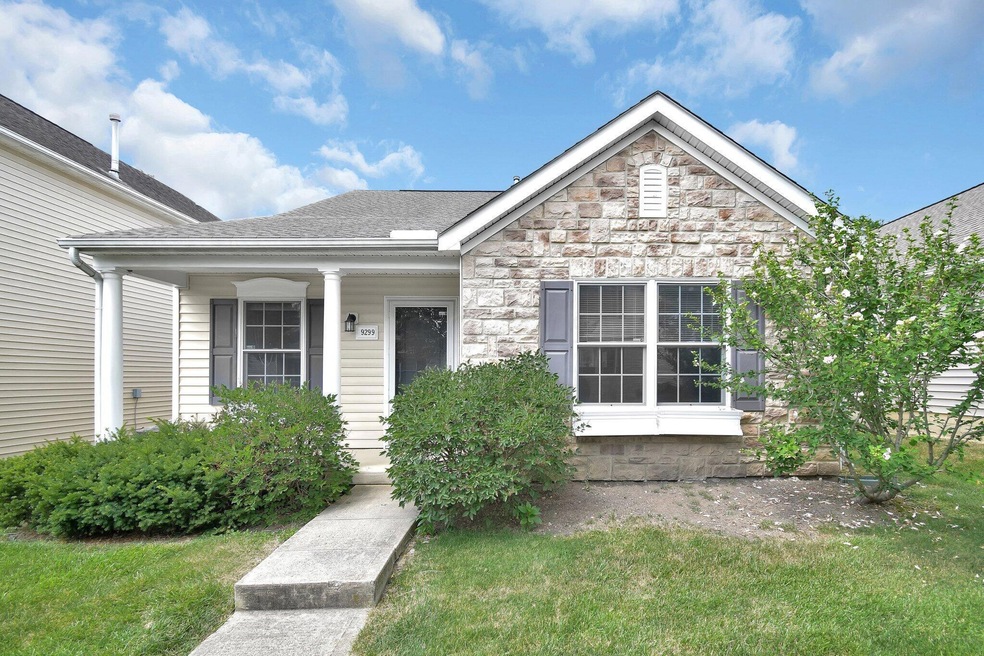
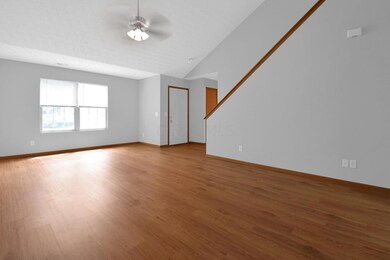
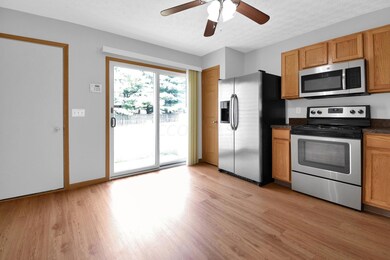
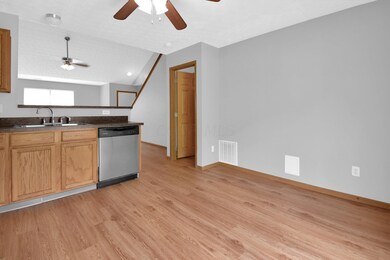
Estimated Value: $311,000 - $352,000
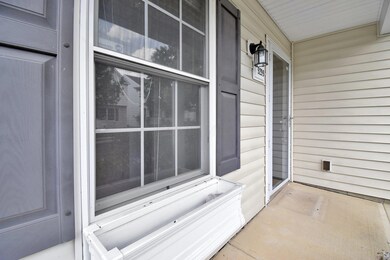
REO Property, Property Sold AS-IS W/O Repair, Warranty or Seller Disclosure. The Listing Broker & Seller make no guarantees as to the accuracy of information herein; Buyer or Buyer’s Agent is responsible for utility activation related to inspections, Water activation not authorized; air pressure test only.
Last Agent to Rent the Property
Keller Williams Consultants License #2016006358 Listed on: 07/16/2024

Last Renter's Agent
Keller Williams Consultants License #2016006358 Listed on: 07/16/2024
| Date | Buyer | Sale Price | Title Company |
|---|---|---|---|
| Tam Homes Llc | -- | None Available | |
| Marsh Troy | $113,159 | None Available | |
| Hsbc Bank Usa N A | $116,000 | None Available | |
| Bonsky Robin S | $165,100 | Alliance |
| Date | Status | Borrower | Loan Amount |
|---|---|---|---|
| Previous Owner | Bonsky Robin S | $33,020 | |
| Previous Owner | Bonsky Robin S | $132,080 |
| Date | Event | Price | List to Sale | Price per Sq Ft | Prior Sale |
|---|---|---|---|---|---|
| 03/27/2025 03/27/25 | Off Market | $113,159 | -- | -- | |
| 03/27/2025 03/27/25 | Off Market | $1,375 | -- | -- | |
| 09/10/2024 09/10/24 | Rented | $1,995 | 0.0% | -- | |
| 08/19/2024 08/19/24 | Price Changed | $1,995 | -4.8% | $2 / Sq Ft | |
| 07/16/2024 07/16/24 | Price Changed | $2,095 | +7.4% | $2 / Sq Ft | |
| 07/16/2024 07/16/24 | For Rent | $1,950 | +41.8% | -- | |
| 03/02/2015 03/02/15 | Rented | $1,375 | -1.8% | -- | |
| 01/31/2015 01/31/15 | Under Contract | -- | -- | -- | |
| 01/04/2015 01/04/15 | For Rent | $1,400 | 0.0% | -- | |
| 12/16/2014 12/16/14 | Sold | $113,159 | -5.5% | $88 / Sq Ft | View Prior Sale |
| 11/16/2014 11/16/14 | Pending | -- | -- | -- | |
| 10/17/2014 10/17/14 | For Sale | $119,800 | -- | $93 / Sq Ft |
| Year | Tax Paid | Tax Assessment Tax Assessment Total Assessment is a certain percentage of the fair market value that is determined by local assessors to be the total taxable value of land and additions on the property. | Land | Improvement |
|---|---|---|---|---|
| 2024 | $4,728 | $84,950 | $16,980 | $67,970 |
| 2023 | $4,746 | $84,950 | $16,980 | $67,970 |
| 2022 | $4,401 | $64,130 | $14,110 | $50,020 |
| 2021 | $4,427 | $64,130 | $14,110 | $50,020 |
| 2020 | $4,452 | $64,130 | $14,110 | $50,020 |
| 2019 | $3,501 | $52,260 | $12,250 | $40,010 |
| 2018 | $3,517 | $52,260 | $12,250 | $40,010 |
| 2017 | $3,481 | $50,160 | $12,250 | $37,910 |
| 2016 | $3,595 | $50,160 | $12,250 | $37,910 |
| 2015 | $3,294 | $50,160 | $12,250 | $37,910 |
| 2014 | $3,248 | $50,160 | $12,250 | $37,910 |
| 2013 | $3,322 | $50,160 | $12,250 | $37,910 |
K
Landlord's Agent in 2024
Kyle Cumming
Keller Williams Consultants
(614) 595-1908
16 Total Sales
T
Seller's Agent in 2015
Troy Marsh
Keller Williams Capital Ptnrs
N
Buyer's Agent in 2015
NON MEMBER
NON MEMBER OFFICE
A
Seller's Agent in 2014
Aaron Brailer
RealHome Services andSolutions
(888) 876-3372
598 Total Sales
Source: Columbus and Central Ohio Regional MLS
MLS Number: 224024384
APN: 318-424-14-013-000
Disclaimer: Certain information contained herein is derived from information provided by parties other than Homes.com. All information provided is deemed reliable, but is not guaranteed to be accurate and should be independently verified.
![]() IDX information is provided exclusively for personal, non-commercial use, and may not be used for any purpose other than to identify prospective properties consumers may be interested in purchasing.
IDX information is provided exclusively for personal, non-commercial use, and may not be used for any purpose other than to identify prospective properties consumers may be interested in purchasing.
Information is deemed reliable but not guaranteed.