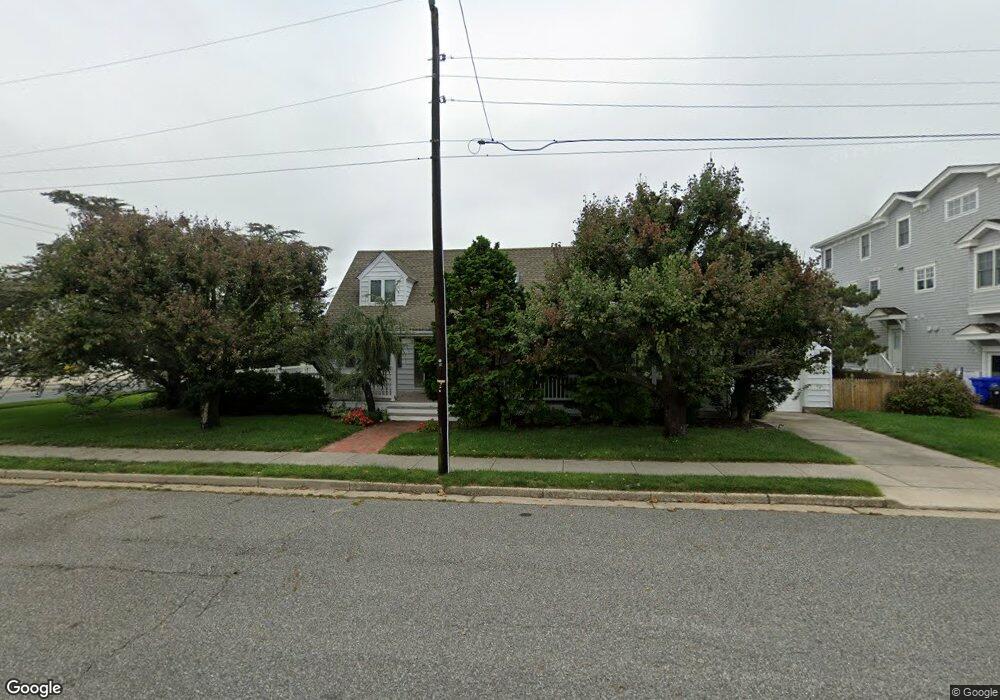
93 15th St W Avalon, NJ 08202
Estimated Value: $2,935,103 - $3,746,000
--
Bed
--
Bath
1,998
Sq Ft
$1,666/Sq Ft
Est. Value
About This Home
This home is located at 93 15th St W, Avalon, NJ 08202 and is currently estimated at $3,328,276, approximately $1,665 per square foot. 93 15th St W is a home located in Cape May County with nearby schools including Avalon Elementary School.
Ownership History
Date
Name
Owned For
Owner Type
Purchase Details
Closed on
Dec 16, 2002
Sold by
Smith James O'Hara
Bought by
Cochet Christine K and Cochet Paul M
Current Estimated Value
Home Financials for this Owner
Home Financials are based on the most recent Mortgage that was taken out on this home.
Original Mortgage
$704,000
Outstanding Balance
$300,660
Interest Rate
6.16%
Estimated Equity
$3,027,616
Purchase Details
Closed on
Dec 18, 1991
Sold by
Phanstiel Howard G and Phanstiel Mary K
Bought by
Smith James O and Smith Gwili A
Create a Home Valuation Report for This Property
The Home Valuation Report is an in-depth analysis detailing your home's value as well as a comparison with similar homes in the area
Home Values in the Area
Average Home Value in this Area
Purchase History
| Date | Buyer | Sale Price | Title Company |
|---|---|---|---|
| Cochet Christine K | $880,000 | -- | |
| Smith James O | $367,000 | -- |
Source: Public Records
Mortgage History
| Date | Status | Borrower | Loan Amount |
|---|---|---|---|
| Open | Cochet Christine K | $704,000 |
Source: Public Records
Tax History Compared to Growth
Tax History
| Year | Tax Paid | Tax Assessment Tax Assessment Total Assessment is a certain percentage of the fair market value that is determined by local assessors to be the total taxable value of land and additions on the property. | Land | Improvement |
|---|---|---|---|---|
| 2025 | $8,297 | $1,351,300 | $1,250,000 | $101,300 |
| 2024 | $8,297 | $1,351,300 | $1,250,000 | $101,300 |
| 2023 | $8,229 | $1,351,300 | $1,250,000 | $101,300 |
| 2022 | $7,675 | $1,351,300 | $1,250,000 | $101,300 |
| 2021 | $7,392 | $1,351,300 | $1,250,000 | $101,300 |
| 2020 | $7,108 | $1,351,300 | $1,250,000 | $101,300 |
| 2019 | $6,892 | $1,351,300 | $1,250,000 | $101,300 |
| 2018 | $6,594 | $1,351,300 | $1,250,000 | $101,300 |
| 2017 | $5,799 | $1,042,900 | $945,000 | $97,900 |
| 2016 | $5,736 | $1,042,900 | $945,000 | $97,900 |
| 2015 | $5,642 | $1,042,900 | $945,000 | $97,900 |
| 2014 | $5,580 | $1,042,900 | $945,000 | $97,900 |
Source: Public Records
Map
Nearby Homes