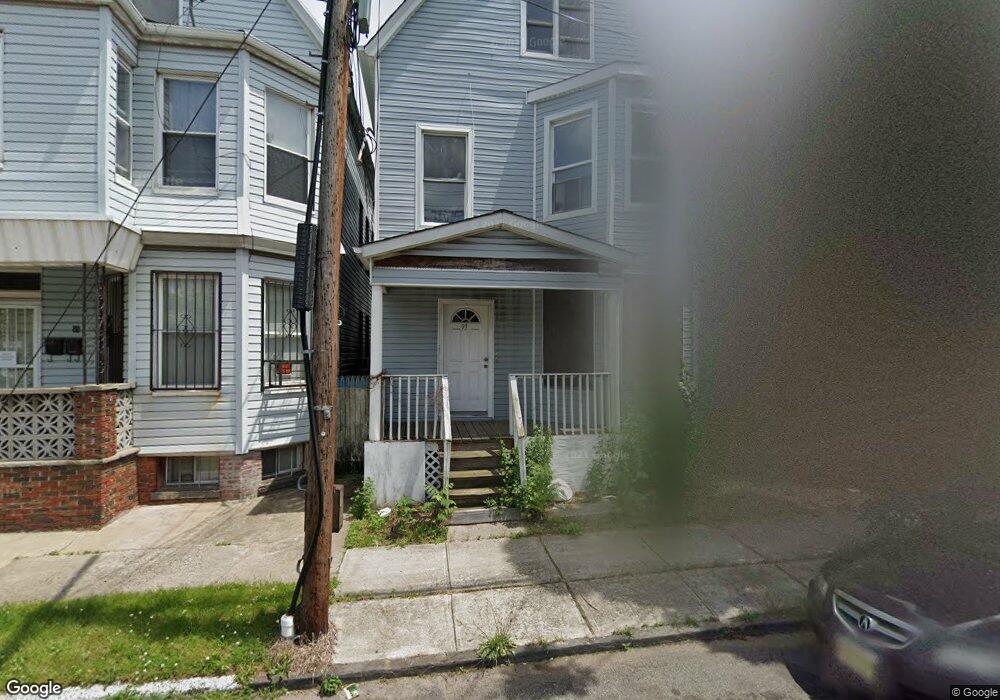
93 3rd St Newark, NJ 07107
Fairmount NeighborhoodEstimated Value: $582,633
Studio
--
Bath
4,230
Sq Ft
$138/Sq Ft
Est. Value
About This Home
This home is located at 93 3rd St, Newark, NJ 07107 and is currently estimated at $582,633, approximately $137 per square foot. 93 3rd St is a home located in Essex County with nearby schools including Sir Isaac Newton Elementary School, Camden Street Elementary School, and Cleveland Elementary School.
Ownership History
Date
Name
Owned For
Owner Type
Purchase Details
Closed on
Jan 8, 2021
Sold by
City Of Newark
Bought by
Newark Invest
Current Estimated Value
Purchase Details
Closed on
Apr 18, 2006
Sold by
Mountain View Lake Investment
Bought by
Ferrando Franklin
Home Financials for this Owner
Home Financials are based on the most recent Mortgage that was taken out on this home.
Original Mortgage
$308,000
Interest Rate
6.24%
Purchase Details
Closed on
Nov 9, 2005
Sold by
Miller Neil
Bought by
Mountainview Lake Investments
Create a Home Valuation Report for This Property
The Home Valuation Report is an in-depth analysis detailing your home's value as well as a comparison with similar homes in the area
Home Values in the Area
Average Home Value in this Area
Purchase History
| Date | Buyer | Sale Price | Title Company |
|---|---|---|---|
| Newark Invest | -- | None Available | |
| Ferrando Franklin | $375,000 | -- | |
| Mountainview Lake Investments | $140,000 | -- |
Source: Public Records
Mortgage History
| Date | Status | Borrower | Loan Amount |
|---|---|---|---|
| Previous Owner | Ferrando Franklin | $308,000 |
Source: Public Records
Tax History
| Year | Tax Paid | Tax Assessment Tax Assessment Total Assessment is a certain percentage of the fair market value that is determined by local assessors to be the total taxable value of land and additions on the property. | Land | Improvement |
|---|---|---|---|---|
| 2025 | -- | $144,000 | $20,800 | $123,200 |
| 2024 | -- | $144,000 | $20,800 | $123,200 |
| 2022 | -- | $144,000 | $20,800 | $123,200 |
| 2021 | $0 | $144,000 | $20,800 | $123,200 |
| 2020 | $0 | $144,000 | $20,800 | $123,200 |
| 2019 | $0 | $144,000 | $20,800 | $123,200 |
| 2018 | $0 | $144,000 | $20,800 | $123,200 |
| 2017 | $5,053 | $144,000 | $20,800 | $123,200 |
| 2016 | $4,954 | $144,000 | $20,800 | $123,200 |
| 2015 | $4,765 | $144,000 | $20,800 | $123,200 |
| 2014 | $4,465 | $144,000 | $20,800 | $123,200 |
Source: Public Records
Map
Nearby Homes
Your Personal Tour Guide
Ask me questions while you tour the home.