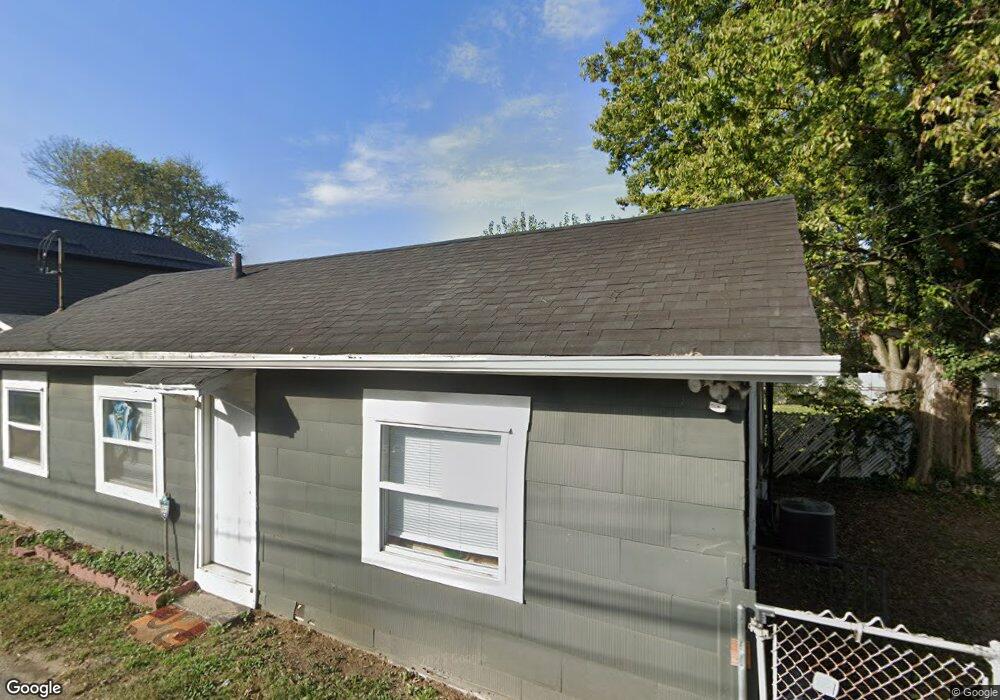
93 E Moler St Columbus, OH 43207
Merion Village NeighborhoodEstimated Value: $393,000 - $430,000
5
Beds
4
Baths
2,380
Sq Ft
$173/Sq Ft
Est. Value
About This Home
This home is located at 93 E Moler St, Columbus, OH 43207 and is currently estimated at $412,309, approximately $173 per square foot. 93 E Moler St is a home located in Franklin County with nearby schools including Southwood Elementary School, South High School, and South Columbus Preparatory Academy.
Ownership History
Date
Name
Owned For
Owner Type
Purchase Details
Closed on
Nov 12, 2021
Sold by
Weiker Alexander L and Rice Marc A
Bought by
React Ventures 93 Llc
Current Estimated Value
Home Financials for this Owner
Home Financials are based on the most recent Mortgage that was taken out on this home.
Original Mortgage
$300,000
Outstanding Balance
$264,436
Interest Rate
3.05%
Mortgage Type
Future Advance Clause Open End Mortgage
Estimated Equity
$147,873
Purchase Details
Closed on
Aug 28, 2019
Sold by
Red Door Building Llc
Bought by
Weiker Alexander L and Rice Marc A
Home Financials for this Owner
Home Financials are based on the most recent Mortgage that was taken out on this home.
Original Mortgage
$218,500
Interest Rate
3.8%
Mortgage Type
New Conventional
Purchase Details
Closed on
Aug 5, 2005
Sold by
Reed Claudy E and Reed Geraldine D
Bought by
Red Door Building Llc
Purchase Details
Closed on
Oct 30, 1989
Bought by
Reed Claudy E
Create a Home Valuation Report for This Property
The Home Valuation Report is an in-depth analysis detailing your home's value as well as a comparison with similar homes in the area
Home Values in the Area
Average Home Value in this Area
Purchase History
| Date | Buyer | Sale Price | Title Company |
|---|---|---|---|
| React Ventures 93 Llc | -- | Title Co Ltd | |
| Weiker Alexander L | $230,000 | Elite Land Title | |
| Red Door Building Llc | $80,000 | Amerititle | |
| Reed Claudy E | $56,000 | -- |
Source: Public Records
Mortgage History
| Date | Status | Borrower | Loan Amount |
|---|---|---|---|
| Open | React Ventures 93 Llc | $300,000 | |
| Previous Owner | Weiker Alexander L | $218,500 |
Source: Public Records
Tax History
| Year | Tax Paid | Tax Assessment Tax Assessment Total Assessment is a certain percentage of the fair market value that is determined by local assessors to be the total taxable value of land and additions on the property. | Land | Improvement |
|---|---|---|---|---|
| 2025 | $6,370 | $138,990 | $44,240 | $94,750 |
| 2024 | $6,370 | $138,990 | $44,240 | $94,750 |
| 2023 | $6,290 | $138,985 | $44,240 | $94,745 |
| 2022 | $3,891 | $73,220 | $10,710 | $62,510 |
| 2021 | $4,015 | $73,220 | $10,710 | $62,510 |
| 2020 | $4,020 | $73,220 | $10,710 | $62,510 |
| 2019 | $2,908 | $46,770 | $7,950 | $38,820 |
| 2018 | $2,767 | $46,770 | $7,950 | $38,820 |
| 2017 | $2,899 | $46,770 | $7,950 | $38,820 |
| 2016 | $2,889 | $42,530 | $7,350 | $35,180 |
| 2015 | $2,631 | $42,530 | $7,350 | $35,180 |
| 2014 | $2,637 | $42,530 | $7,350 | $35,180 |
| 2013 | $1,445 | $47,250 | $8,155 | $39,095 |
Source: Public Records
Map
Nearby Homes
- 1373 S 4th St
- 1366 S 4th St
- 165 Frebis Ave
- 1361 City Park Ave
- 1367 City Park Ave
- 1389 S 6th St
- 1264 S High St
- 6 Hanford St Unit 6
- 154-156 E Gates St
- 272 E Jenkins Ave
- 1542 S 4th St Unit 1542
- 1543 S 4th St Unit 1543
- 218 E Markison Ave
- 148 E Welch Ave
- 1563 S 6th St
- 169 Thurman Ave Unit 169
- 1583 S 4th St
- 348-350 E Moler St
- 247-249 Thurman Ave
- 220 E Welch Ave
- 85 E Moler St Unit 91
- 101 E Moler St
- 79 E Moler St Unit 81
- 105 E Moler St
- 1354 S 3rd St
- 1358 S 3rd St
- 1364 S 3rd St
- 1364 S 3rd St Unit 366
- 1364 S 3rd St Unit (REAR)
- 1364 S 3rd St Unit 1364-1366
- 86 E Moler St
- 106 E Moler St
- 1364 S 3rd (Rear) St
- 1363 S 4th St
- 1360 S 3rd St Unit ID1072691P
- 1360 S 3rd St
- 104 W Moler St
- 92 E Moler St
- 98 E Moler St
- 1364-1366 S 3rd St
Your Personal Tour Guide
Ask me questions while you tour the home.