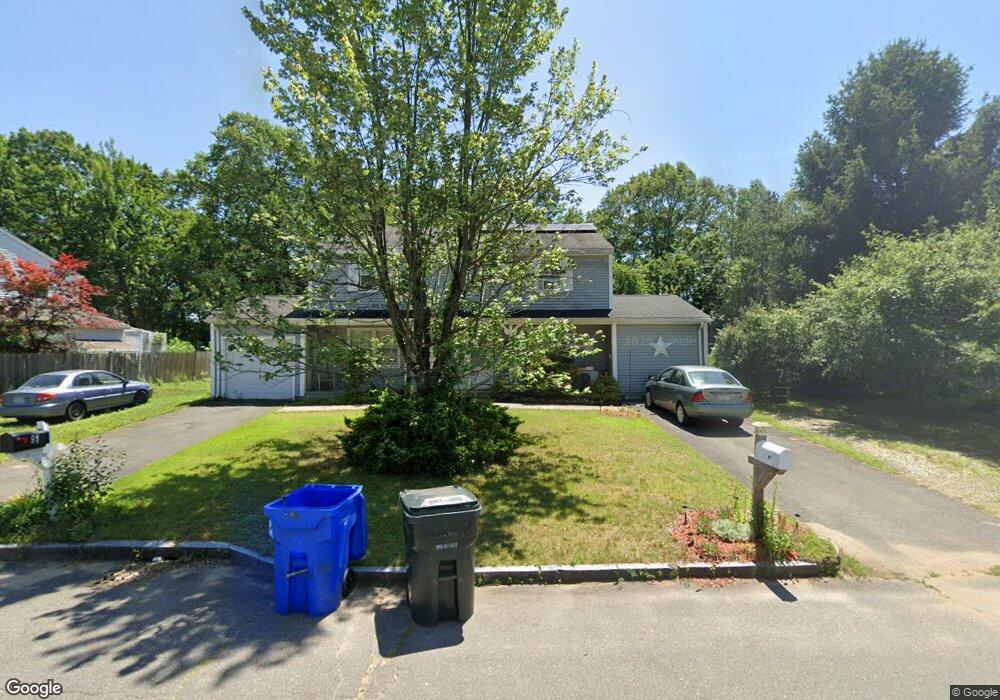
93 Glenmore St Springfield, MA 01129
Boston Road NeighborhoodEstimated Value: $266,000 - $314,000
2
Beds
2
Baths
1,116
Sq Ft
$261/Sq Ft
Est. Value
About This Home
This home is located at 93 Glenmore St, Springfield, MA 01129 and is currently estimated at $290,946, approximately $260 per square foot. 93 Glenmore St is a home located in Hampden County with nearby schools including Warner, John F. Kennedy Academy, and Roger L. Putnam Vocational Technical Academy.
Ownership History
Date
Name
Owned For
Owner Type
Purchase Details
Closed on
Mar 22, 2023
Sold by
Henderson Sonia D
Bought by
S D Henderson 2023 Ret
Current Estimated Value
Purchase Details
Closed on
Aug 8, 2008
Sold by
Dionne Carol A
Bought by
Henderson Sonia D
Home Financials for this Owner
Home Financials are based on the most recent Mortgage that was taken out on this home.
Original Mortgage
$117,161
Interest Rate
6.49%
Mortgage Type
Purchase Money Mortgage
Purchase Details
Closed on
Apr 25, 1997
Sold by
Department Of Housing & Urban Dev
Bought by
Dionne Michael and Dionne Carol A
Home Financials for this Owner
Home Financials are based on the most recent Mortgage that was taken out on this home.
Original Mortgage
$50,685
Interest Rate
7.77%
Mortgage Type
Purchase Money Mortgage
Create a Home Valuation Report for This Property
The Home Valuation Report is an in-depth analysis detailing your home's value as well as a comparison with similar homes in the area
Home Values in the Area
Average Home Value in this Area
Purchase History
| Date | Buyer | Sale Price | Title Company |
|---|---|---|---|
| S D Henderson 2023 Ret | -- | None Available | |
| Henderson Sonia D | $119,000 | -- | |
| Dionne Michael | $51,101 | -- |
Source: Public Records
Mortgage History
| Date | Status | Borrower | Loan Amount |
|---|---|---|---|
| Previous Owner | Henderson Sonia D | $117,161 | |
| Previous Owner | Dionne Michael | $50,685 |
Source: Public Records
Tax History
| Year | Tax Paid | Tax Assessment Tax Assessment Total Assessment is a certain percentage of the fair market value that is determined by local assessors to be the total taxable value of land and additions on the property. | Land | Improvement |
|---|---|---|---|---|
| 2025 | $3,544 | $226,000 | $44,800 | $181,200 |
| 2024 | $3,271 | $203,700 | $41,900 | $161,800 |
| 2023 | $3,258 | $191,100 | $34,400 | $156,700 |
| 2022 | $3,410 | $181,200 | $32,100 | $149,100 |
| 2021 | $2,792 | $147,700 | $29,200 | $118,500 |
| 2020 | $2,535 | $129,800 | $36,300 | $93,500 |
| 2019 | $2,551 | $129,600 | $36,300 | $93,300 |
| 2018 | $2,501 | $127,100 | $36,300 | $90,800 |
| 2017 | $3,238 | $164,700 | $36,300 | $128,400 |
| 2016 | $2,912 | $148,100 | $36,300 | $111,800 |
| 2015 | $2,829 | $143,800 | $36,300 | $107,500 |
Source: Public Records
Map
Nearby Homes
- 101 Glenmore St
- 91 Glenmore St
- 91 Glenmore St Unit NO
- 107 Glenmore St
- 81 Glenmore St
- 79 Glenmore St
- 111 Glenmore St
- 75 Glenmore St
- 115 Glenmore St
- 98 Glenmore St
- 104 Glenmore St
- 94 Glenmore St
- 106 Glenmore St
- 71 Glenmore St
- 90 Glenmore St
- 121 Glenmore St
- 80 Glenmore St
- 88 Glenmore St
- 112 Glenmore St
- 82 Glenmore St
Your Personal Tour Guide
Ask me questions while you tour the home.