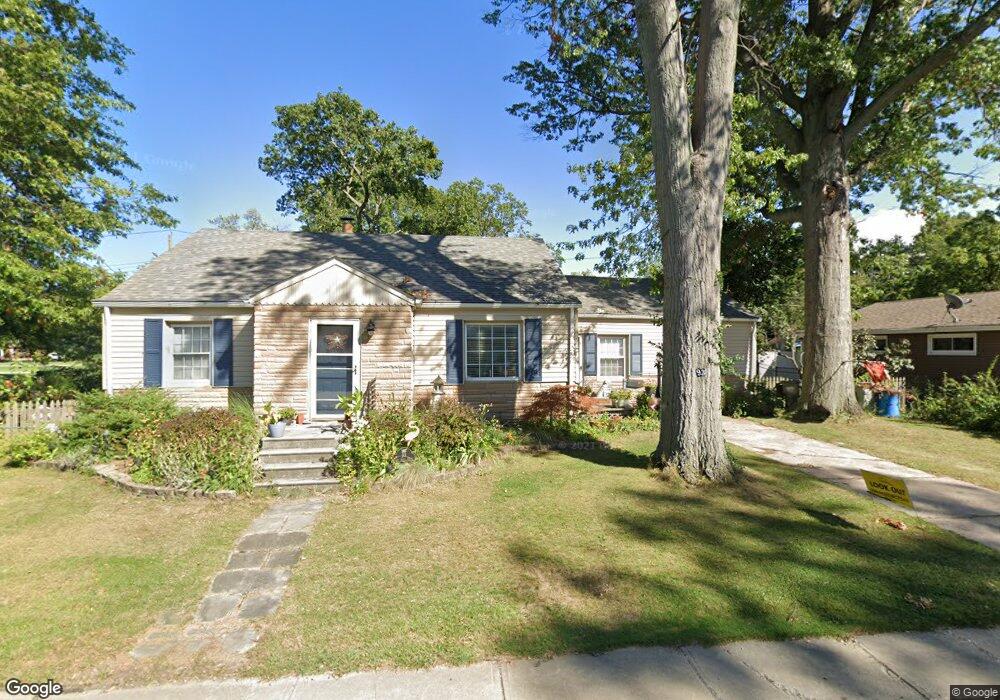
93 Gra Gull Dr Avon Lake, OH 44012
Estimated Value: $269,000 - $332,000
3
Beds
1
Bath
1,613
Sq Ft
$188/Sq Ft
Est. Value
About This Home
This home is located at 93 Gra Gull Dr, Avon Lake, OH 44012 and is currently estimated at $303,435, approximately $188 per square foot. 93 Gra Gull Dr is a home located in Lorain County with nearby schools including Erieview Elementary School, Troy Intermediate Elementary School, and Learwood Middle School.
Ownership History
Date
Name
Owned For
Owner Type
Purchase Details
Closed on
Jun 22, 2005
Sold by
Reynolds Michael S and Reynolds Julie A
Bought by
Murphy Pamela K
Current Estimated Value
Home Financials for this Owner
Home Financials are based on the most recent Mortgage that was taken out on this home.
Original Mortgage
$148,000
Outstanding Balance
$77,215
Interest Rate
5.75%
Mortgage Type
Fannie Mae Freddie Mac
Estimated Equity
$226,220
Purchase Details
Closed on
Feb 22, 2000
Sold by
Liberatore Nancy L
Bought by
Reynolds Michael S and Reynolds Julie A
Home Financials for this Owner
Home Financials are based on the most recent Mortgage that was taken out on this home.
Original Mortgage
$128,250
Interest Rate
7.75%
Purchase Details
Closed on
Sep 26, 1996
Sold by
Grunick Rebecca J
Bought by
Liberatore Nancy L
Home Financials for this Owner
Home Financials are based on the most recent Mortgage that was taken out on this home.
Original Mortgage
$25,000
Interest Rate
7.97%
Mortgage Type
New Conventional
Create a Home Valuation Report for This Property
The Home Valuation Report is an in-depth analysis detailing your home's value as well as a comparison with similar homes in the area
Home Values in the Area
Average Home Value in this Area
Purchase History
| Date | Buyer | Sale Price | Title Company |
|---|---|---|---|
| Murphy Pamela K | $185,000 | Chicago Title Insurance Co | |
| Reynolds Michael S | $135,000 | Rockwell Title Agency Inc | |
| Liberatore Nancy L | $127,000 | -- |
Source: Public Records
Mortgage History
| Date | Status | Borrower | Loan Amount |
|---|---|---|---|
| Open | Murphy Pamela K | $148,000 | |
| Previous Owner | Reynolds Michael S | $128,250 | |
| Previous Owner | Liberatore Nancy L | $25,000 | |
| Closed | Murphy Pamela K | $18,500 |
Source: Public Records
Tax History Compared to Growth
Tax History
| Year | Tax Paid | Tax Assessment Tax Assessment Total Assessment is a certain percentage of the fair market value that is determined by local assessors to be the total taxable value of land and additions on the property. | Land | Improvement |
|---|---|---|---|---|
| 2024 | $4,624 | $97,710 | $34,213 | $63,497 |
| 2023 | $3,749 | $70,480 | $31,031 | $39,449 |
| 2022 | $3,710 | $70,480 | $31,031 | $39,449 |
| 2021 | $3,702 | $70,480 | $31,030 | $39,450 |
| 2020 | $3,639 | $64,190 | $28,260 | $35,930 |
| 2019 | $3,619 | $64,190 | $28,260 | $35,930 |
| 2018 | $3,545 | $64,190 | $28,260 | $35,930 |
| 2017 | $3,459 | $56,280 | $23,310 | $32,970 |
| 2016 | $3,441 | $56,280 | $23,310 | $32,970 |
| 2015 | $3,458 | $56,280 | $23,310 | $32,970 |
| 2014 | $3,167 | $49,130 | $20,350 | $28,780 |
| 2013 | $3,191 | $49,130 | $20,350 | $28,780 |
Source: Public Records
Map
Nearby Homes
- 128 Forest Hill Dr
- 137 Armour Rd
- 205 Sunset Rd
- 250 Vineyard Rd
- 32894 Lake Rd
- 252 Yoder Blvd
- 230 Glenview Dr
- 223 Parsons Dr
- 126 Parkwood Ave
- 32863 Redwood Blvd
- S/L 2 Redwood Blvd
- 279 Briargate Ct
- 330 Inwood Blvd
- 417 Armour Rd
- 30 Landings Way Unit 30
- 32581 Captains Galley
- 80 Landings Way Unit 80
- 34 Community Dr Unit 34
- 110 Oakwood Dr
- 175 Curtis Dr
- 87 Gra Gull Dr
- 97 Gra Gull Dr
- 92 Gra Gull Dr
- 90 Gra Gull Dr
- 98 Gra Gull Dr
- 84 Gra Gull Dr
- 83 Gra Gull Dr
- 32624 Lake Rd
- 93 Maplecliff Dr
- 89 Maplecliff Dr
- 82 Gra Gull Dr
- 85 Maplecliff Dr
- 32600 Lake Rd
- 81 Gra Gull Dr
- 32590 Lake Rd
- 81 Maplecliff Dr
- 78 Gra Gull Dr
- 32609 Lake Rd
- 32605 Lake Rd
- 92 Maplecliff Dr