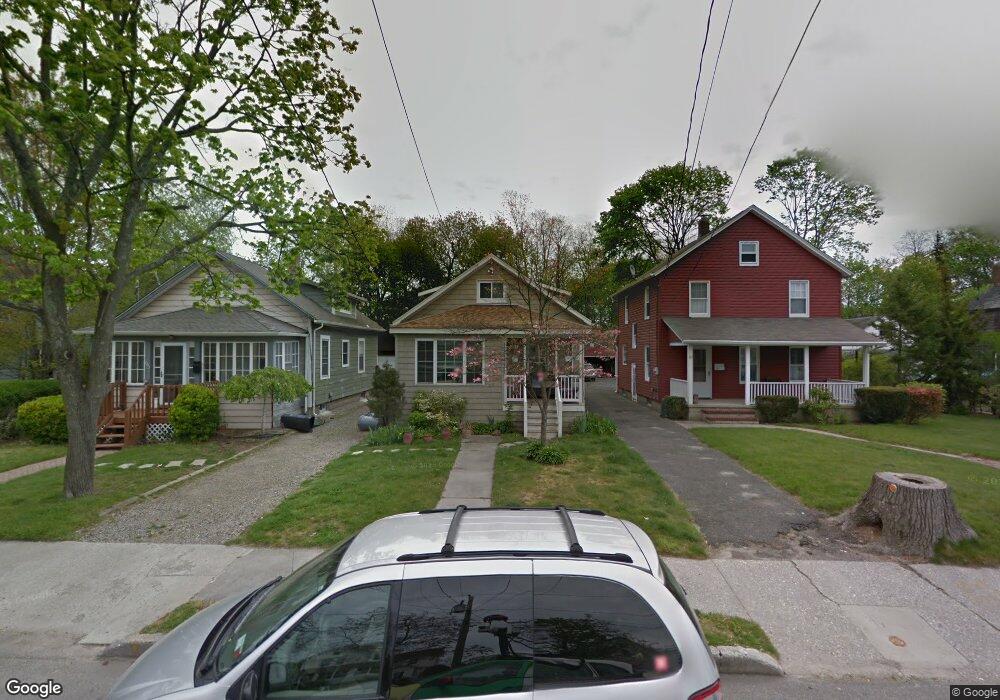
93 Jayne Ave Patchogue, NY 11772
Estimated Value: $454,367 - $581,000
2
Beds
1
Bath
735
Sq Ft
$683/Sq Ft
Est. Value
About This Home
This home is located at 93 Jayne Ave, Patchogue, NY 11772 and is currently estimated at $502,342, approximately $683 per square foot. 93 Jayne Ave is a home located in Suffolk County with nearby schools including Patchogue-Medford High School and Holy Angels Regional School.
Ownership History
Date
Name
Owned For
Owner Type
Purchase Details
Closed on
Oct 30, 2000
Sold by
Carlson Paula A
Bought by
Iovine Dana
Current Estimated Value
Home Financials for this Owner
Home Financials are based on the most recent Mortgage that was taken out on this home.
Original Mortgage
$123,451
Outstanding Balance
$45,262
Interest Rate
7.81%
Mortgage Type
FHA
Estimated Equity
$457,080
Purchase Details
Closed on
Dec 29, 1998
Sold by
Carlson John and Carlson Paula
Bought by
Carlson Paula A
Create a Home Valuation Report for This Property
The Home Valuation Report is an in-depth analysis detailing your home's value as well as a comparison with similar homes in the area
Home Values in the Area
Average Home Value in this Area
Purchase History
| Date | Buyer | Sale Price | Title Company |
|---|---|---|---|
| Iovine Dana | $125,500 | Fidelity National Title Ins | |
| Carlson Paula A | -- | Fidelity National Title |
Source: Public Records
Mortgage History
| Date | Status | Borrower | Loan Amount |
|---|---|---|---|
| Open | Iovine Dana | $123,451 |
Source: Public Records
Tax History
| Year | Tax Paid | Tax Assessment Tax Assessment Total Assessment is a certain percentage of the fair market value that is determined by local assessors to be the total taxable value of land and additions on the property. | Land | Improvement |
|---|---|---|---|---|
| 2024 | $7,744 | $1,600 | $400 | $1,200 |
| 2023 | $5,340 | $1,600 | $400 | $1,200 |
| 2022 | $4,523 | $1,600 | $400 | $1,200 |
| 2021 | $4,523 | $1,600 | $400 | $1,200 |
| 2020 | $6,992 | $1,600 | $400 | $1,200 |
| 2019 | $6,964 | $0 | $0 | $0 |
| 2018 | $4,344 | $1,600 | $400 | $1,200 |
| 2017 | $4,344 | $1,600 | $400 | $1,200 |
| 2016 | $4,234 | $1,600 | $400 | $1,200 |
| 2015 | -- | $1,600 | $400 | $1,200 |
| 2014 | -- | $1,600 | $400 | $1,200 |
Source: Public Records
Map
Nearby Homes
Your Personal Tour Guide
Ask me questions while you tour the home.