Estimated Value: $1,658,794 - $1,886,000
About This Home
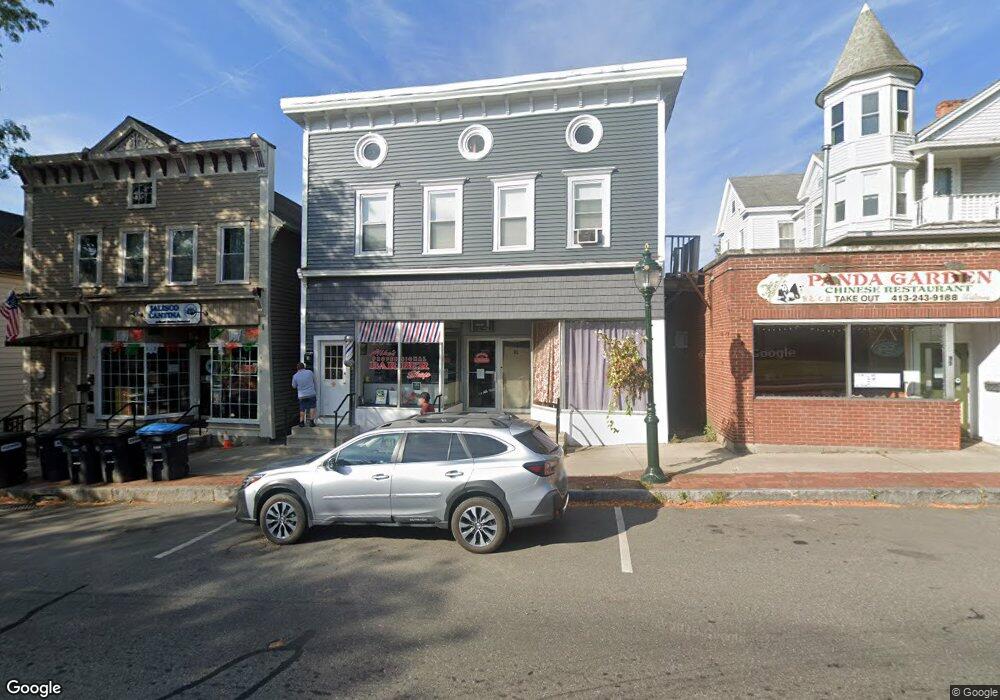
This home is located at 93 Main St, Lee, MA 01238 and is currently estimated at $1,805,598, approximately $364 per square foot. 93 Main St is a home located in Berkshire County with nearby schools including Lee Elementary School, Lee Middle/High School, and St. Mary's School.
Ownership History
We collect this data history from publicly available records. To have your information removed, we recommend requesting removal directly through your county’s website.
Purchase Details
Home Financials for this Owner
Home Financials are based on the most recent Mortgage that was taken out on this home.Purchase Details
Home Values in the Area
Average Home Value in this Area
Purchase History
We collect this data history from publicly available records. To have your information removed, we recommend requesting removal directly through your county’s website.
| Date | Buyer | Sale Price | Title Company |
|---|---|---|---|
| $1,400,000 | None Available | ||
| $375,000 | -- |
Mortgage History
We collect this data history from publicly available records. To have your information removed, we recommend requesting removal directly through your county’s website.
| Date | Status | Borrower | Loan Amount |
|---|---|---|---|
| Open | $500,000 |
Tax History
We collect this data history from publicly available records. To have your information removed, we recommend requesting removal directly through your county’s website.
| Year | Tax Paid | Tax Assessment Tax Assessment Total Assessment is a certain percentage of the fair market value that is determined by local assessors to be the total taxable value of land and additions on the property. | Land | Improvement |
|---|---|---|---|---|
| 2025 | $9,409 | $1,537,400 | $154,000 | $1,383,400 |
| 2024 | $9,065 | $1,448,100 | $149,600 | $1,298,500 |
| 2023 | $9,161 | $1,392,300 | $142,900 | $1,249,400 |
| 2022 | $7,884 | $1,173,200 | $142,900 | $1,030,300 |
| 2021 | $7,027 | $1,018,400 | $138,600 | $879,800 |
| 2020 | $6,358 | $909,600 | $138,600 | $771,000 |
| 2019 | $6,029 | $898,500 | $138,600 | $759,900 |
| 2018 | $6,176 | $887,300 | $138,600 | $748,700 |
| 2017 | $6,144 | $877,700 | $137,300 | $740,400 |
| 2016 | $5,845 | $867,200 | $137,300 | $729,900 |
| 2015 | $5,680 | $852,900 | $137,300 | $715,600 |
Map
- 160 High St
- 205 High St
- 180 Center St
- 75 Housatonic St
- 100 S Prospect St
- 155 Laurel St
- 50 Mountain View Terrace
- 2 Devon Rd
- 15 Tamarack Ave
- 135 Tamarack Ave
- 15 Martin Ave
- 135 East St
- 25 Golden Hill Rd
- 485 Golden Hill Rd
- 205 Golden Hill Rd
- 55 Paul Dr
- 555 Marble St
- 832 East St
- 53 Tabar Ave
- 465 Chapel St
Ask me questions while you tour the home.