Estimated Value: $460,000 - $512,000
3
Beds
1
Bath
1,484
Sq Ft
$333/Sq Ft
Est. Value
About This Home
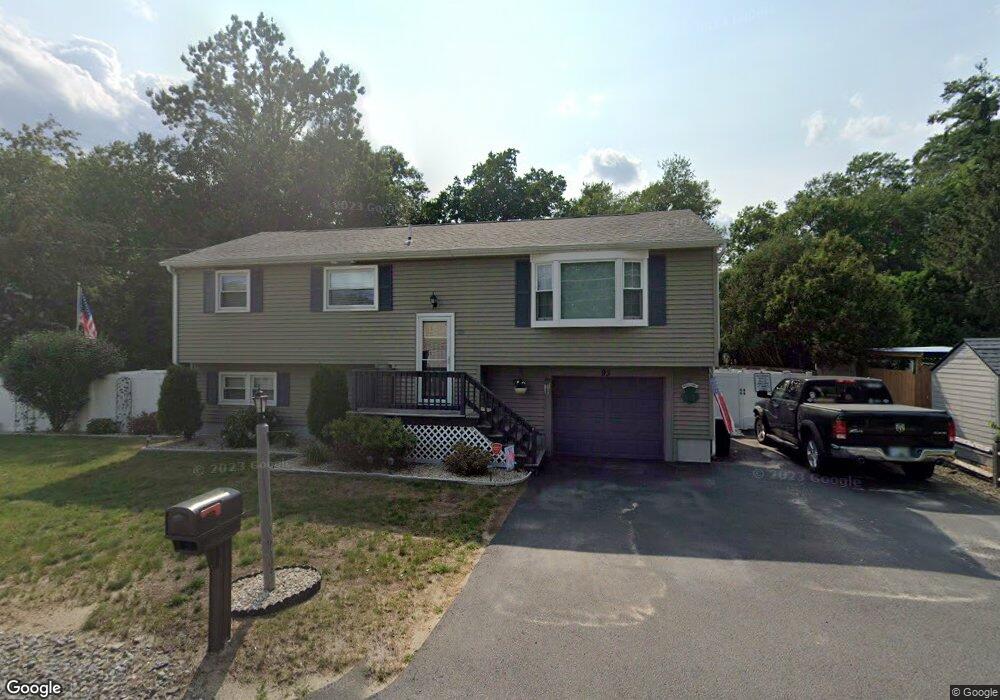
This home is located at 93 N Main St, Salem, NH 03079 and is currently estimated at $493,575, approximately $332 per square foot. 93 N Main St is a home located in Rockingham County with nearby schools including William T. Barron Elementary School, Woodbury School, and Salem High School.
Ownership History
Date
Name
Owned For
Owner Type
Purchase Details
Closed on
Aug 1, 2011
Sold by
Smith Zina B
Bought by
Sheehan Michael E and Sheehan Ida Marie
Current Estimated Value
Home Financials for this Owner
Home Financials are based on the most recent Mortgage that was taken out on this home.
Original Mortgage
$160,716
Outstanding Balance
$111,018
Interest Rate
4.52%
Mortgage Type
Purchase Money Mortgage
Estimated Equity
$382,557
Purchase Details
Closed on
Dec 1, 1997
Sold by
Carey Sharon L
Bought by
Smith Kenneth D
Home Financials for this Owner
Home Financials are based on the most recent Mortgage that was taken out on this home.
Original Mortgage
$106,200
Interest Rate
7.26%
Mortgage Type
Purchase Money Mortgage
Create a Home Valuation Report for This Property
The Home Valuation Report is an in-depth analysis detailing your home's value as well as a comparison with similar homes in the area
Home Values in the Area
Average Home Value in this Area
Purchase History
| Date | Buyer | Sale Price | Title Company |
|---|---|---|---|
| Sheehan Michael E | $167,500 | -- | |
| Smith Kenneth D | $272,900 | -- |
Source: Public Records
Mortgage History
| Date | Status | Borrower | Loan Amount |
|---|---|---|---|
| Open | Smith Kenneth D | $160,716 | |
| Previous Owner | Smith Kenneth D | $106,200 |
Source: Public Records
Tax History Compared to Growth
Tax History
| Year | Tax Paid | Tax Assessment Tax Assessment Total Assessment is a certain percentage of the fair market value that is determined by local assessors to be the total taxable value of land and additions on the property. | Land | Improvement |
|---|---|---|---|---|
| 2024 | $6,267 | $356,100 | $150,600 | $205,500 |
| 2023 | $6,039 | $356,100 | $150,600 | $205,500 |
| 2022 | $5,715 | $356,100 | $150,600 | $205,500 |
| 2021 | $5,690 | $356,100 | $150,600 | $205,500 |
| 2020 | $5,038 | $228,800 | $107,800 | $121,000 |
| 2019 | $5,029 | $228,800 | $107,800 | $121,000 |
| 2018 | $4,696 | $217,300 | $107,800 | $109,500 |
| 2017 | $4,529 | $217,300 | $107,800 | $109,500 |
| 2016 | $4,439 | $217,300 | $107,800 | $109,500 |
| 2015 | $4,188 | $195,800 | $108,200 | $87,600 |
| 2014 | $4,071 | $195,800 | $108,200 | $87,600 |
| 2013 | $4,006 | $195,800 | $108,200 | $87,600 |
Source: Public Records
Map
Nearby Homes
- 27 General Pulaski Dr
- 51 Bluff St
- 1 Kimball Ave
- 8 Arcadia Ln
- 3 Roux Ave
- 55A Millville Cir
- 8 Stoneybrook Ln
- 312 Shore Dr
- 22 Nolet Ave
- 1 Ballard Ln
- 51 Zion Hill Rd
- 6 Douglas Dr
- 30 Scotland Ave
- Massabesic Plan at Atkinson Heights
- Jenness Plan at Atkinson Heights
- Gloucester Plan at Atkinson Heights
- Berkshire Plan at Atkinson Heights
- Allagash Plan at Atkinson Heights
- Franconia Plan at Atkinson Heights
- Dartmouth Plan at Atkinson Heights