
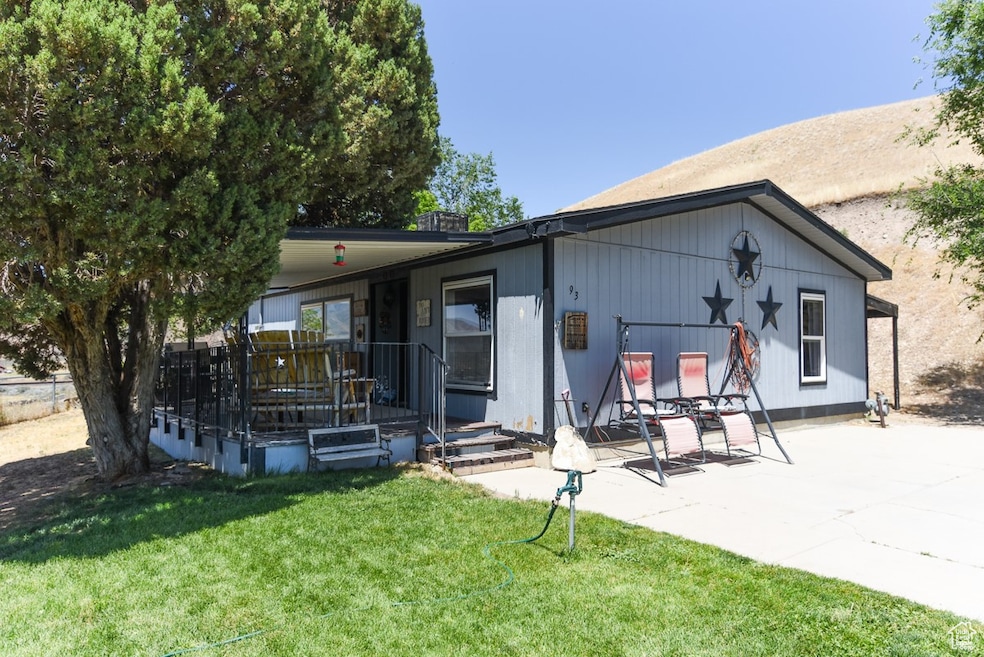
93 N Sherman St Stockton, UT 84071
Estimated payment $1,791/month
Total Views
388
3
Beds
2
Baths
1,113
Sq Ft
$260
Price per Sq Ft
Highlights
- RV or Boat Parking
- Mountain View
- Secluded Lot
- Mature Trees
- Mountainous Lot
- Vaulted Ceiling
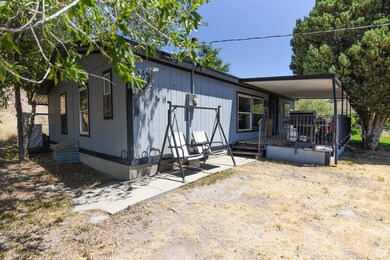
About This Home
Beautifully maintained 3-bedroom, 2-bath home perched privately atop a hill, offering breathtaking panoramic views that stretch for miles. This serene retreat sits on a spacious 0.60-acre lot, with room to expand-there's potential to excavate the mountain and create additional flat space to suit your vision. The roof is just 2 years old, adding peace of mind to this already move-in-ready haven. All furnishings are available for sale-negotiable-making it easy to step right into your dream lifestyle.
Property Details
Home Type
- Manufactured Home
Est. Annual Taxes
- $2,196
Year Built
- Built in 1996
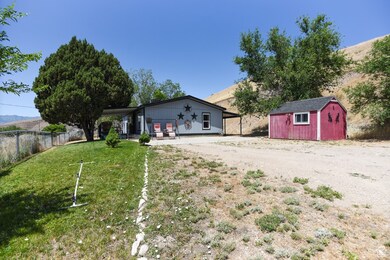
Lot Details
- 0.61 Acre Lot
- Dog Run
- Partially Fenced Property
- Landscaped
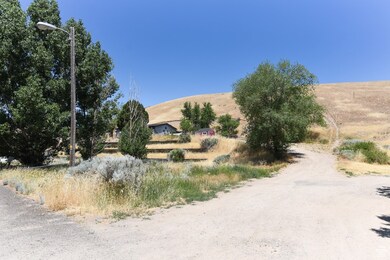
- Secluded Lot
- Terraced Lot
- Unpaved Streets
- Mountainous Lot
- Mature Trees
Property Views
- Mountain
- Valley
Home Design
- Clapboard
Interior Spaces
- 1,113 Sq Ft Home
- 1-Story Property
- Vaulted Ceiling
- Ceiling Fan
- Double Pane Windows
- Blinds
Kitchen
- Free-Standing Range
- Range Hood
- Microwave
- Freezer
- Disposal
Flooring
- Carpet
- Laminate
Bedrooms and Bathrooms
- 3 Main Level Bedrooms
- Walk-In Closet
- 2 Full Bathrooms
Laundry
- Dryer
- Washer
Parking
- 1 Parking Space
- 1 Carport Space
- RV or Boat Parking
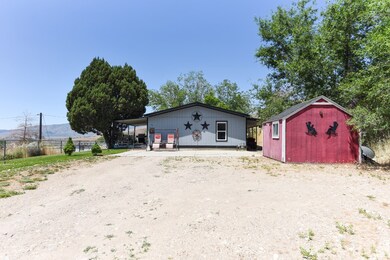
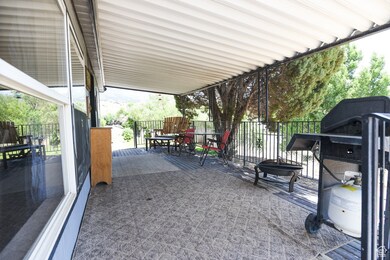
Outdoor Features
- Storage Shed
- Outbuilding
- Outdoor Gas Grill
Schools
- Settlement Canyon Elementary School
- Tooele Middle School
- Tooele High School
Utilities
- Evaporated cooling system
- Forced Air Heating System
- Natural Gas Connected
- Satellite Dish
Community Details
- No Home Owners Association
Listing and Financial Details
- Exclusions: Satellite Dish
- Assessor Parcel Number 01-195-0-0004
Map
Create a Home Valuation Report for This Property
The Home Valuation Report is an in-depth analysis detailing your home's value as well as a comparison with similar homes in the area
Home Values in the Area
Average Home Value in this Area
Tax History
| Year | Tax Paid | Tax Assessment Tax Assessment Total Assessment is a certain percentage of the fair market value that is determined by local assessors to be the total taxable value of land and additions on the property. | Land | Improvement |
|---|---|---|---|---|
| 2024 | $2,196 | $161,821 | $55,138 | $106,683 |
| 2023 | $2,196 | $159,394 | $55,138 | $104,256 |
| 2022 | $2,115 | $170,927 | $52,993 | $117,934 |
| 2021 | $1,728 | $116,327 | $52,993 | $63,334 |
| 2020 | $1,603 | $180,546 | $24,000 | $156,546 |
| 2019 | $1,294 | $154,455 | $24,000 | $130,455 |
| 2018 | $1,122 | $124,350 | $24,000 | $100,350 |
| 2017 | $848 | $107,625 | $24,000 | $83,625 |
| 2016 | $916 | $59,194 | $13,200 | $45,994 |
| 2015 | $916 | $61,937 | $0 | $0 |
| 2014 | $768 | $61,937 | $0 | $0 |
Source: Public Records
Property History
| Date | Event | Price | Change | Sq Ft Price |
|---|---|---|---|---|
| 06/19/2025 06/19/25 | For Sale | $289,900 | -- | $260 / Sq Ft |
Source: UtahRealEstate.com
Purchase History
| Date | Type | Sale Price | Title Company |
|---|---|---|---|
| Warranty Deed | -- | United West Title | |
| Special Warranty Deed | -- | Cornerstone Title Insurance | |
| Interfamily Deed Transfer | -- | None Available | |
| Trustee Deed | $117,665 | None Available | |
| Warranty Deed | -- | Equity Title |
Source: Public Records
Mortgage History
| Date | Status | Loan Amount | Loan Type |
|---|---|---|---|
| Previous Owner | $36,300 | Unknown | |
| Previous Owner | $5,300 | Stand Alone Second | |
| Previous Owner | $107,808 | FHA | |
| Previous Owner | $1,200 | Unknown |
Source: Public Records
Similar Homes in Stockton, UT
Source: UtahRealEstate.com
MLS Number: 2093553
APN: 01-195-0-0004
Disclaimer: Certain information contained herein is derived from information provided by parties other than Homes.com. All information provided is deemed reliable, but is not guaranteed to be accurate and should be independently verified.
![]() IDX information is provided exclusively for consumers’ personal, non-commercial use, that it may not be used for any purpose other than to identify prospective properties consumers may be interested in purchasing, and that the data is deemed reliable but is not guaranteed accurate by the MLS. Licensor is only providing the MLS Content and not other sources of data provided in the Product.
IDX information is provided exclusively for consumers’ personal, non-commercial use, that it may not be used for any purpose other than to identify prospective properties consumers may be interested in purchasing, and that the data is deemed reliable but is not guaranteed accurate by the MLS. Licensor is only providing the MLS Content and not other sources of data provided in the Product.
Based on information from the Wasatch Front Regional Multiple Listing Service, Inc.. All data, including all measurements and calculations of area, is obtained from various sources and has not been, and will not be, verified by broker or the MLS. All information should be independently reviewed and verified for accuracy. Properties may or may not be listed by the office/agent presenting the information.
Nearby Homes
- 60 S Johnson St
- 25 W Pearson
- 282 S Sheridan St
- 305 S Sheridan St
- 609 E 900 S
- 0 E Bald Mountain Rd
- 1843 W Big Sky Dr
- 0 Utah 36
- 1984 W Ridgeline Rd
- 2258 W Deer Run Dr Unit 174
- 2521 W Ridgeline Rd
- 3017 W Ridgeline Rd
- 3214 W Ridgeline Rd
- 1054 S 1050 W
- 1081 S 900 W
- 799 3 O'Clock Dr
- 1018 S 810 W
- 1082 Southland Dr
- 765 1 O'Clock Dr
- 615 W 1080 S