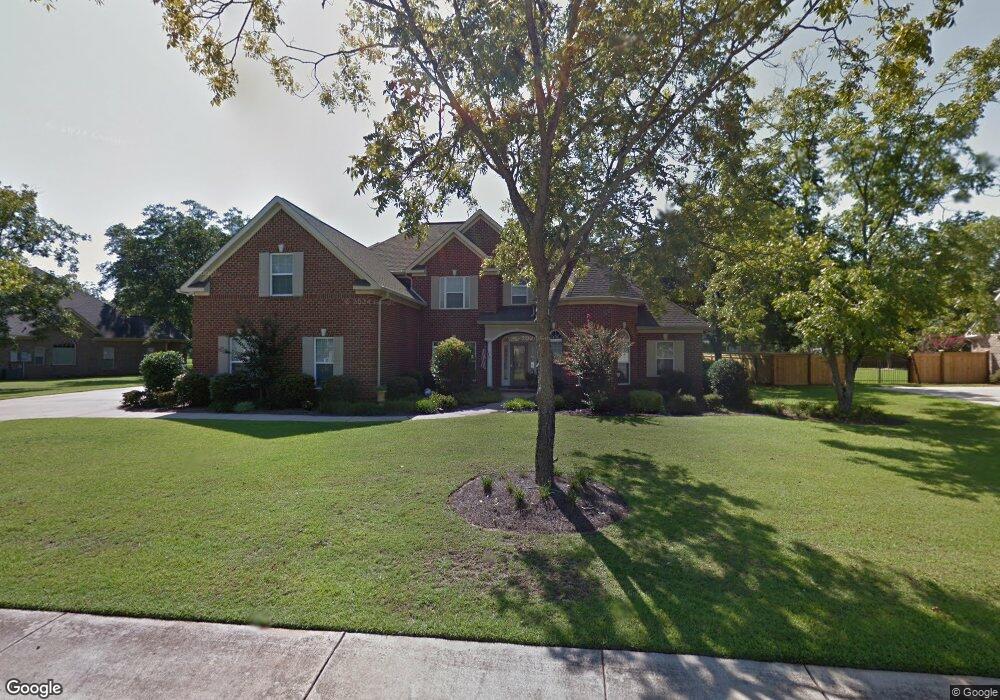
93 Pembroke Pointe Centerville, GA 31028
Estimated Value: $501,446 - $603,000
4
Beds
4
Baths
3,564
Sq Ft
$154/Sq Ft
Est. Value
About This Home
This home is located at 93 Pembroke Pointe, Centerville, GA 31028 and is currently estimated at $547,862, approximately $153 per square foot. 93 Pembroke Pointe is a home located in Houston County with nearby schools including Eagle Springs Elementary School, Thomson Middle School, and Northside High School.
Ownership History
Date
Name
Owned For
Owner Type
Purchase Details
Closed on
Jan 15, 2021
Sold by
Khan Shireen Anjum
Bought by
Khan Ahmed Irfan
Current Estimated Value
Purchase Details
Closed on
Dec 11, 2015
Sold by
Nguyen Quan
Bought by
Khan Mohd V A and Khan Basheer
Purchase Details
Closed on
May 6, 2011
Sold by
Stewart James N and Stewart Kristi V
Bought by
Johnson James N and Johnson Joanna M
Home Financials for this Owner
Home Financials are based on the most recent Mortgage that was taken out on this home.
Original Mortgage
$369,000
Interest Rate
4.81%
Mortgage Type
VA
Purchase Details
Closed on
May 15, 2006
Sold by
Pmc Homes Llc
Bought by
Stewart James N and Stewart Kristi
Home Financials for this Owner
Home Financials are based on the most recent Mortgage that was taken out on this home.
Original Mortgage
$240,000
Interest Rate
5.87%
Mortgage Type
New Conventional
Create a Home Valuation Report for This Property
The Home Valuation Report is an in-depth analysis detailing your home's value as well as a comparison with similar homes in the area
Home Values in the Area
Average Home Value in this Area
Purchase History
| Date | Buyer | Sale Price | Title Company |
|---|---|---|---|
| Khan Ahmed Irfan | $182,500 | None Available | |
| Khan Ahmed Irfan | -- | None Available | |
| Khan Mohd V A | $320,000 | -- | |
| Johnson James N | $369,000 | None Available | |
| Stewart James N | $354,900 | None Available |
Source: Public Records
Mortgage History
| Date | Status | Borrower | Loan Amount |
|---|---|---|---|
| Previous Owner | Johnson James N | $369,000 | |
| Previous Owner | Stewart James N | $240,000 |
Source: Public Records
Tax History
| Year | Tax Paid | Tax Assessment Tax Assessment Total Assessment is a certain percentage of the fair market value that is determined by local assessors to be the total taxable value of land and additions on the property. | Land | Improvement |
|---|---|---|---|---|
| 2024 | $6,746 | $194,480 | $15,800 | $178,680 |
| 2023 | $6,040 | $172,880 | $15,800 | $157,080 |
| 2022 | $3,565 | $155,040 | $15,800 | $139,240 |
| 2021 | $3,123 | $137,080 | $15,800 | $121,280 |
| 2020 | $3,138 | $137,080 | $18,000 | $119,080 |
| 2019 | $3,133 | $136,840 | $18,000 | $118,840 |
| 2018 | $3,086 | $134,840 | $16,000 | $118,840 |
| 2017 | $3,089 | $134,840 | $16,000 | $118,840 |
| 2016 | $2,981 | $134,840 | $16,000 | $118,840 |
| 2015 | $3,147 | $134,840 | $16,000 | $118,840 |
| 2014 | -- | $134,840 | $16,000 | $118,840 |
| 2013 | -- | $134,560 | $16,000 | $118,560 |
Source: Public Records
Map
Nearby Homes
- 209 Trellis Walk
- 304 Montview Way
- 106 Bretwood Ct
- 116 Tivoli Park Rd
- 100 Jamestown Ct
- 104 Orchard Ln
- 102 Macintosh Ln
- 509 Saint Marlo Dr
- 119 Bartlett Way
- 115 Montrose Ln
- 306 Thomson St
- 132 Montrose Ln
- 111 Montrose Ln
- 105 Park Ln
- 103 Westoak Ct
- 107 Miller Ct
- 708 N Houston Lake Blvd
- 102 Lee St Unit 117 Wilson Drive
- 102 Lee St
- 202 Bassett St
- 93 Pembroke Point
- 95 Pembroke Point
- 95 Pembroke Point Unit 2
- 95 Pembroke Pointe
- 91 Pembroke Point
- 91 Pembroke Pointe
- 94 Pembroke Pointe
- 96 Pembroke Point
- 105 Chalet Cove
- 107 Chalet Cove
- 89 Pembroke Point
- 97 Pembroke Point
- 97 Pembroke Pointe Unit 5
- 97 Pembroke Pointe
- 89 Pembroke Pointe
- 92 Pembroke Point
- 103 Chalet Cove
- 109 Chalet Cove
- 98 Pembroke Point
- 87 Pembroke Pointe
Your Personal Tour Guide
Ask me questions while you tour the home.