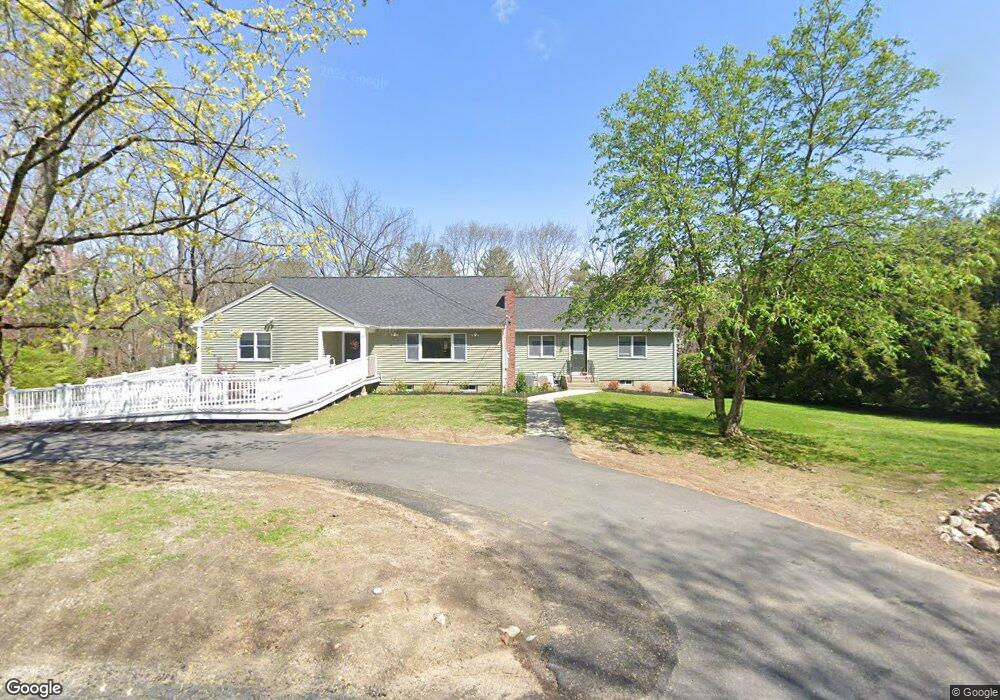
93 Powers Rd Sudbury, MA 01776
Estimated Value: $902,500
5
Beds
3
Baths
2,211
Sq Ft
$408/Sq Ft
Est. Value
About This Home
This home is located at 93 Powers Rd, Sudbury, MA 01776 and is currently priced at $902,500, approximately $408 per square foot. 93 Powers Rd is a home located in Middlesex County with nearby schools including Josiah Haynes Elementary School, Ephraim Curtis Middle School, and Lincoln-Sudbury Regional High School.
Ownership History
Date
Name
Owned For
Owner Type
Purchase Details
Closed on
Mar 5, 2020
Sold by
Karon Jeffrey H and Karon Susan R
Bought by
Cil Realty Of Mass Inc
Current Estimated Value
Home Financials for this Owner
Home Financials are based on the most recent Mortgage that was taken out on this home.
Original Mortgage
$1,380,827
Outstanding Balance
$1,225,228
Interest Rate
3.6%
Mortgage Type
Purchase Money Mortgage
Purchase Details
Closed on
Nov 30, 2000
Sold by
Collier Rebecca S
Bought by
Karon Jeffrey H and Karon Susanr
Home Financials for this Owner
Home Financials are based on the most recent Mortgage that was taken out on this home.
Original Mortgage
$200,000
Interest Rate
7.76%
Mortgage Type
Purchase Money Mortgage
Create a Home Valuation Report for This Property
The Home Valuation Report is an in-depth analysis detailing your home's value as well as a comparison with similar homes in the area
Home Values in the Area
Average Home Value in this Area
Purchase History
| Date | Buyer | Sale Price | Title Company |
|---|---|---|---|
| Cil Realty Of Mass Inc | $540,000 | None Available | |
| Karon Jeffrey H | $444,150 | -- |
Source: Public Records
Mortgage History
| Date | Status | Borrower | Loan Amount |
|---|---|---|---|
| Open | Cil Realty Of Mass Inc | $1,380,827 | |
| Previous Owner | Karon Jeffrey H | $200,000 | |
| Previous Owner | Karon Jeffrey H | $140,000 |
Source: Public Records
Tax History
| Year | Tax Paid | Tax Assessment Tax Assessment Total Assessment is a certain percentage of the fair market value that is determined by local assessors to be the total taxable value of land and additions on the property. | Land | Improvement |
|---|---|---|---|---|
| 2025 | $0 | $848,300 | $441,200 | $407,100 |
| 2024 | $11,428 | $820,800 | $428,400 | $392,400 |
| 2023 | $0 | $767,700 | $396,800 | $370,900 |
| 2022 | $0 | $644,500 | $364,400 | $280,100 |
| 2021 | $11,428 | $606,900 | $364,400 | $242,500 |
| 2020 | $11,197 | $606,900 | $364,400 | $242,500 |
| 2019 | $10,870 | $606,900 | $364,400 | $242,500 |
| 2018 | $10,121 | $564,500 | $388,400 | $176,100 |
| 2017 | $9,287 | $523,500 | $369,600 | $153,900 |
| 2016 | $8,952 | $502,900 | $355,600 | $147,300 |
| 2015 | $8,182 | $464,900 | $342,000 | $122,900 |
| 2014 | $8,178 | $453,600 | $332,000 | $121,600 |
Source: Public Records
Map
Nearby Homes
- 20 Cobblestone Place
- 8 Snowberry Ln
- 68 Longfellow Rd
- 2 Skyview Ln
- 42 Dakin Rd
- 19 Skyview Ln
- 377 Willis Rd
- 48 Chanticleer Rd
- 41 Old Coach Rd
- 96 Forest Ridge Rd Unit 96
- 96 Mossman Rd
- 23 Deer Path Unit 5
- 62 Waltham St
- 31-33 Roosevelt St
- 5 Hayes St Unit 5
- 22 Douglas Ave Unit 2
- 22 Douglas Ave Unit 1
- 70 Powder Mill Rd
- 13 Arthur St Unit 15
- 56 Seymour St
- 87 Powers Rd
- 105 Powers Rd
- 0 Lot 0 Powers Rd Unit 50498207
- 0 Powers Rd
- 106 Powers Rd
- 167 Maynard Farm Rd
- 82 Powers Rd
- 98 Powers Rd
- 115 Powers Rd
- 70 Powers Rd
- 172 Maynard Farm Rd
- 157 Maynard Farm Rd
- 112 Powers Rd
- 21 Maynard Farm Rd
- 164 Maynard Farm Rd
- 76 Powers Rd
- 120 Powers Rd
- 125 Powers Rd
- 149 Maynard Farm Rd
- 17 Deer Pond Rd
Your Personal Tour Guide
Ask me questions while you tour the home.