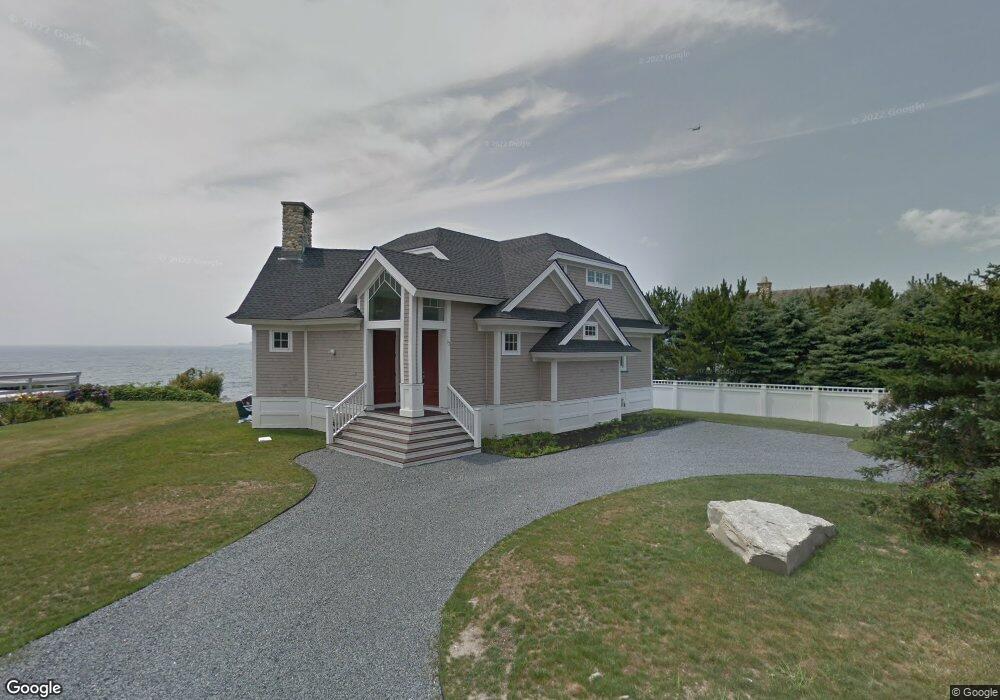
93 Shore Dr Middletown, RI 02842
Estimated Value: $2,618,000 - $4,076,000
3
Beds
3
Baths
2,359
Sq Ft
$1,424/Sq Ft
Est. Value
About This Home
This home is located at 93 Shore Dr, Middletown, RI 02842 and is currently estimated at $3,358,780, approximately $1,423 per square foot. 93 Shore Dr is a home located in Newport County with nearby schools including Middletown High School, St Michael's Country Day School, and St George's School.
Ownership History
Date
Name
Owned For
Owner Type
Purchase Details
Closed on
Dec 29, 1994
Sold by
Blasbalg Tr Arnold L
Bought by
Oconell James J
Current Estimated Value
Create a Home Valuation Report for This Property
The Home Valuation Report is an in-depth analysis detailing your home's value as well as a comparison with similar homes in the area
Home Values in the Area
Average Home Value in this Area
Purchase History
We collect this data history from publicly available records. To have your information removed, we recommend requesting removal directly through your county’s website.
| Date | Buyer | Sale Price | Title Company |
|---|---|---|---|
| Oconell James J | $252,000 | -- |
Source: Public Records
Mortgage History
We collect this data history from publicly available records. To have your information removed, we recommend requesting removal directly through your county’s website.
| Date | Status | Borrower | Loan Amount |
|---|---|---|---|
| Open | Oconell James J | $300,000 | |
| Closed | Oconell James J | $417,000 | |
| Closed | Oconell James J | $475,000 |
Source: Public Records
Tax History
| Year | Tax Paid | Tax Assessment Tax Assessment Total Assessment is a certain percentage of the fair market value that is determined by local assessors to be the total taxable value of land and additions on the property. | Land | Improvement |
|---|---|---|---|---|
| 2025 | $35,317 | $2,995,500 | $2,623,200 | $372,300 |
| 2024 | $33,729 | $2,995,500 | $2,623,200 | $372,300 |
| 2023 | $24,981 | $1,984,200 | $1,620,300 | $363,900 |
| 2022 | $23,850 | $1,984,200 | $1,620,300 | $363,900 |
| 2021 | $23,850 | $1,984,200 | $1,620,300 | $363,900 |
| 2020 | $24,398 | $1,773,100 | $1,440,400 | $332,700 |
| 2018 | $24,380 | $1,773,100 | $1,440,400 | $332,700 |
| 2016 | $23,290 | $1,510,400 | $1,123,300 | $387,100 |
| 2015 | $22,716 | $1,510,400 | $1,123,300 | $387,100 |
| 2014 | $23,237 | $1,446,000 | $1,020,700 | $425,300 |
| 2013 | $22,717 | $1,446,000 | $1,020,700 | $425,300 |
Source: Public Records
Map
Nearby Homes
- 2 Stimpson St
- 4 James St
- 11 Odonnell Rd
- 47 Kane Ave
- 57 Tuckerman Ave
- 592 Tuckerman Ave
- 11 Renfrew Ave
- 45 Crescent Rd
- 100 Renfrew Ave
- 118 Newport Ave
- 118 Wolcott Ave
- 11 Gunning Ct
- 78 Ellery Rd
- 4 Dresser St
- 131 Eustis Ave
- 9 Ocean Lawn Ln
- 141 Gray Craig Rd
- 175 Kay St
- 55 John Clarke Rd Unit 8
- 55 John Clarke Rd Unit 3
- 84 Shore Dr
- 74 Shore Dr
- 213 Tuckerman Ave
- 94 Shore Dr
- 203 Tuckerman Ave
- 221 Tuckerman Ave
- 0 Shore Dr Unit 306465
- 0 Shore Dr Unit 306467
- 0 Shore Dr Unit 1354316
- 0 Shore Dr
- 195 Tuckerman Ave
- 103 Shore Dr
- 233 Tuckerman Ave
- 99 Shore Dr
- 189 Tuckerman Ave
- 87 Shore Dr
- 9 Hoover Rd Unit 11
- 9 Hoover Rd Unit A
- 218 Tuckerman Ave
- 241 Tuckerman Ave
Your Personal Tour Guide
Ask me questions while you tour the home.