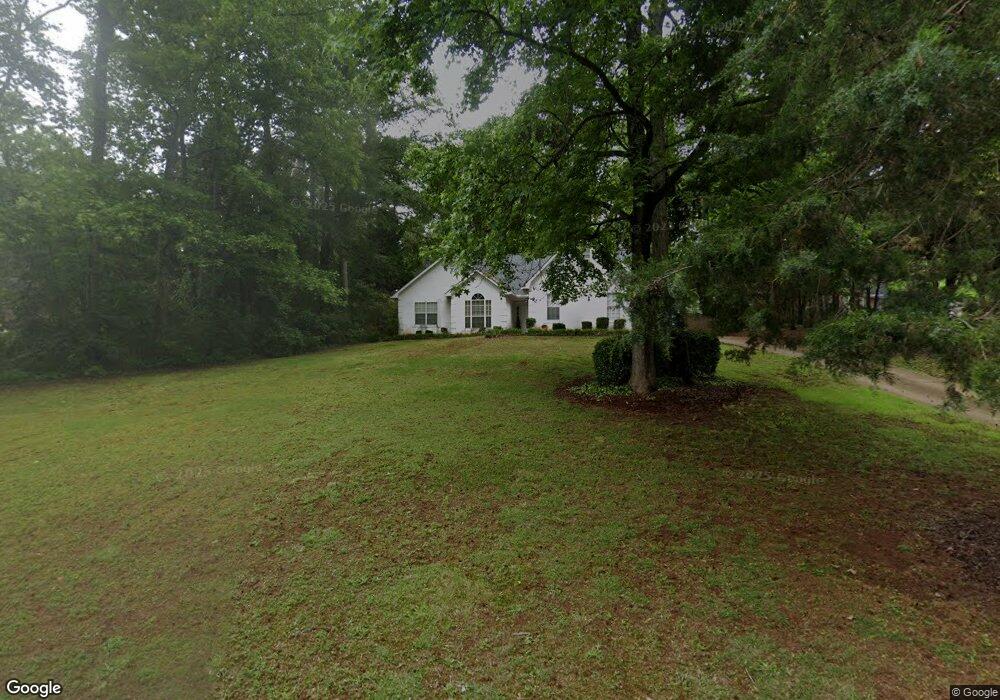
93 Stirling Way Unit 2 Sharpsburg, GA 30277
Estimated Value: $371,212 - $441,000
3
Beds
2
Baths
1,970
Sq Ft
$205/Sq Ft
Est. Value
About This Home
This home is located at 93 Stirling Way Unit 2, Sharpsburg, GA 30277 and is currently estimated at $404,803, approximately $205 per square foot. 93 Stirling Way Unit 2 is a home located in Coweta County with nearby schools including Canongate Elementary School, Madras Middle School, and Northgate High School.
Ownership History
Date
Name
Owned For
Owner Type
Purchase Details
Closed on
Jul 7, 2004
Sold by
Cook John P
Bought by
Cook John P and Cook Stacey
Current Estimated Value
Home Financials for this Owner
Home Financials are based on the most recent Mortgage that was taken out on this home.
Original Mortgage
$143,200
Outstanding Balance
$64,695
Interest Rate
4.88%
Mortgage Type
New Conventional
Estimated Equity
$340,108
Purchase Details
Closed on
Aug 10, 2000
Sold by
Arrue Pablo M
Bought by
Arrue Pablo M and Arrue Miriam M
Home Financials for this Owner
Home Financials are based on the most recent Mortgage that was taken out on this home.
Original Mortgage
$157,998
Interest Rate
8.23%
Mortgage Type
VA
Purchase Details
Closed on
Jun 15, 1992
Bought by
Cunningham Thomas Ha
Purchase Details
Closed on
Nov 25, 1991
Bought by
Mastercraft Homes In
Create a Home Valuation Report for This Property
The Home Valuation Report is an in-depth analysis detailing your home's value as well as a comparison with similar homes in the area
Home Values in the Area
Average Home Value in this Area
Purchase History
| Date | Buyer | Sale Price | Title Company |
|---|---|---|---|
| Cook John P | -- | -- | |
| Cook John P | $179,000 | -- | |
| Arrue Pablo M | -- | -- | |
| Arrue Pablo M | -- | -- | |
| Arrue Pablo M | $154,900 | -- | |
| Cunningham Thomas Ha | $99,900 | -- | |
| Mastercraft Homes In | $52,500 | -- |
Source: Public Records
Mortgage History
| Date | Status | Borrower | Loan Amount |
|---|---|---|---|
| Open | Arrue Pablo M | $143,200 | |
| Previous Owner | Arrue Pablo M | $157,998 |
Source: Public Records
Tax History Compared to Growth
Tax History
| Year | Tax Paid | Tax Assessment Tax Assessment Total Assessment is a certain percentage of the fair market value that is determined by local assessors to be the total taxable value of land and additions on the property. | Land | Improvement |
|---|---|---|---|---|
| 2025 | $2,936 | $129,113 | $30,000 | $99,113 |
| 2024 | $2,944 | $131,416 | $30,000 | $101,416 |
| 2023 | $2,944 | $110,131 | $22,000 | $88,131 |
| 2022 | $2,445 | $103,968 | $22,000 | $81,968 |
| 2021 | $2,106 | $84,674 | $22,000 | $62,674 |
| 2020 | $2,119 | $84,674 | $22,000 | $62,674 |
| 2019 | $1,839 | $67,639 | $12,000 | $55,639 |
| 2018 | $1,843 | $67,639 | $12,000 | $55,639 |
| 2017 | $1,714 | $63,258 | $12,000 | $51,258 |
| 2016 | $1,696 | $63,258 | $12,000 | $51,258 |
| 2015 | $1,520 | $58,001 | $12,000 | $46,001 |
| 2014 | $1,454 | $56,001 | $10,000 | $46,001 |
Source: Public Records
Map
Nearby Homes
- 10 Monteray Ct
- 40 Wenham Ln
- 259 Strathmore Dr Unit 3
- 70 N Strathmore Dr
- 20 Skipton Ct
- 131 Cannongate Cir
- 46 I W Brooks Rd
- 127 Northgate Preserve Dr
- 125 Cannongate Cir
- 12 Race Point Way
- 972 Raymond Hill Rd
- 319 Beaconsfield Dr
- 306 Northgate Preserve Dr
- 851 Raymond Hill Rd
- 9 Warrior Way
- 95 Tyler Woods Dr
- 2043 Fischer Rd
- 25 Sycamore Way
- 2039 Fischer Rd
- LOT 2 Raymond Hill Rd
- 61 Stirling Way Unit 20
- 61 Stirling Way
- 105 Stirling Way
- 0 Stirling Way Unit 8634767
- 0 Stirling Way Unit 7182481
- 0 Stirling Way Unit 8789845
- 0 Stirling Way Unit 8874505
- 0 Stirling Way Unit 3279642
- 0 Stirling Way Unit 7328305
- 0 Stirling Way
- 39 Stirling Way
- 106 Stirling Way Unit 2
- 115 Stirling Way
- 86 Stirling Way Unit 2
- 7 Perth Point
- 29 Stirling Way Unit 22
- 29 Stirling Way
- 110 Stirling Way Unit 2
- 86 Strathmore Dr Unit 2
- 133 Stirling Way