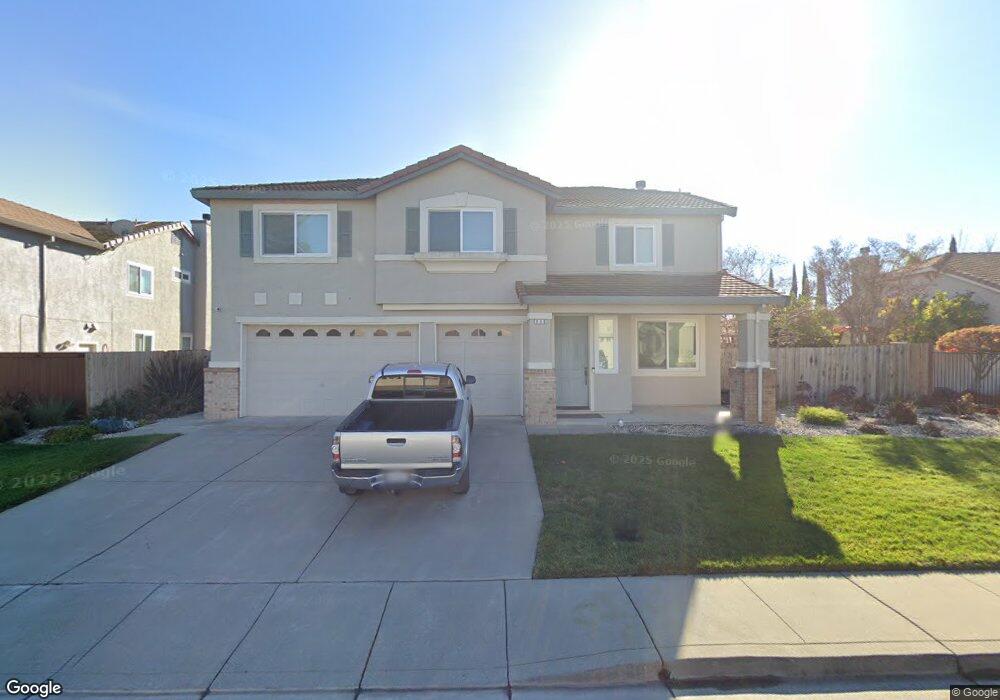
930 Cedarcrest Dr Vacaville, CA 95687
Estimated Value: $806,000 - $865,000
4
Beds
3
Baths
3,014
Sq Ft
$276/Sq Ft
Est. Value
About This Home
This home is located at 930 Cedarcrest Dr, Vacaville, CA 95687 and is currently estimated at $831,010, approximately $275 per square foot. 930 Cedarcrest Dr is a home located in Solano County with nearby schools including Cambridge Elementary School, Golden West Middle School, and Vanden High School.
Ownership History
Date
Name
Owned For
Owner Type
Purchase Details
Closed on
Nov 15, 2017
Sold by
Lovelady Gary T
Bought by
Lovelady Gary and Gary Lovelady Trust
Current Estimated Value
Purchase Details
Closed on
Oct 10, 2013
Sold by
Lovelady Gary I
Bought by
Lovelady Gary T
Home Financials for this Owner
Home Financials are based on the most recent Mortgage that was taken out on this home.
Original Mortgage
$79,175
Interest Rate
4.55%
Mortgage Type
New Conventional
Purchase Details
Closed on
Mar 24, 2011
Sold by
Lovelady Kim M
Bought by
Lovelady Gary T
Purchase Details
Closed on
Dec 10, 1997
Sold by
Lewis Homes Vacaville I
Bought by
Lovelady Gary T and Lovelady Kim M
Home Financials for this Owner
Home Financials are based on the most recent Mortgage that was taken out on this home.
Original Mortgage
$203,150
Interest Rate
7.06%
Create a Home Valuation Report for This Property
The Home Valuation Report is an in-depth analysis detailing your home's value as well as a comparison with similar homes in the area
Purchase History
| Date | Buyer | Sale Price | Title Company |
|---|---|---|---|
| Lovelady Gary | -- | None Available | |
| Lovelady Gary T | -- | Fidelity National Title Co | |
| Lovelady Gary T | -- | None Available | |
| Lovelady Gary T | $226,000 | First American Title Guarant |
Source: Public Records
Mortgage History
| Date | Status | Borrower | Loan Amount |
|---|---|---|---|
| Closed | Lovelady Gary T | $79,175 | |
| Previous Owner | Lovelady Gary T | $203,150 |
Source: Public Records
Tax History Compared to Growth
Tax History
| Year | Tax Paid | Tax Assessment Tax Assessment Total Assessment is a certain percentage of the fair market value that is determined by local assessors to be the total taxable value of land and additions on the property. | Land | Improvement |
|---|---|---|---|---|
| 2025 | $5,232 | $378,270 | $79,835 | $298,435 |
| 2024 | $5,232 | $370,854 | $78,270 | $292,584 |
| 2023 | $5,108 | $363,584 | $76,736 | $286,848 |
| 2022 | $4,997 | $356,456 | $75,232 | $281,224 |
| 2021 | $4,977 | $349,467 | $73,757 | $275,710 |
| 2020 | $4,935 | $345,884 | $73,001 | $272,883 |
| 2019 | $4,843 | $339,103 | $71,570 | $267,533 |
| 2018 | $4,775 | $332,455 | $70,167 | $262,288 |
| 2017 | $4,637 | $325,938 | $68,792 | $257,146 |
| 2016 | $4,579 | $319,548 | $67,444 | $252,104 |
| 2015 | $4,528 | $314,749 | $66,431 | $248,318 |
| 2014 | $4,463 | $308,584 | $65,130 | $243,454 |
Source: Public Records
Map
Nearby Homes
- 1101 Wildplum Ct
- 805 Broadfork Cir
- 897 Sapphire Cir
- 681 Canterbury Cir
- 809 Cookson St
- 773 Peregrine Way
- 766 Calico Trail
- 130 Brighton Cir
- 448 Potters Ln
- 680 Shefford Dr
- 687 Shefford Dr
- 706 Peregrine Way
- 2031 Newcastle Dr
- 2042 Hamstead Ct
- 674 Shefford Dr
- 681 Shefford Dr
- Plan 1549 - Modeled at Sweetbay at Magnolia Park
- Plan 1963 at Sweetbay at Magnolia Park
- Plan 2532 at Sweetbay at Magnolia Park
- 918 Moonstone Ct
- 936 Cedarcrest Dr
- 924 Cedarcrest Dr
- 806 Gentle Creek Ct
- 931 Cedarcrest Dr
- 942 Cedarcrest Dr
- 925 Cedarcrest Dr
- 800 Gentle Creek Ct
- 961 Fallsgrove Way
- 937 Cedarcrest Dr
- 955 Fallsgrove Way
- 919 Cedarcrest Dr
- 818 Gentle Creek Ct
- 943 Cedarcrest Dr
- 954 Mimosa Dr
- 831 Summerbreeze Dr
- 949 Fallsgrove Way
- 837 Summerbreeze Dr
- 824 Gentle Creek Ct
- 913 Cedarcrest Dr