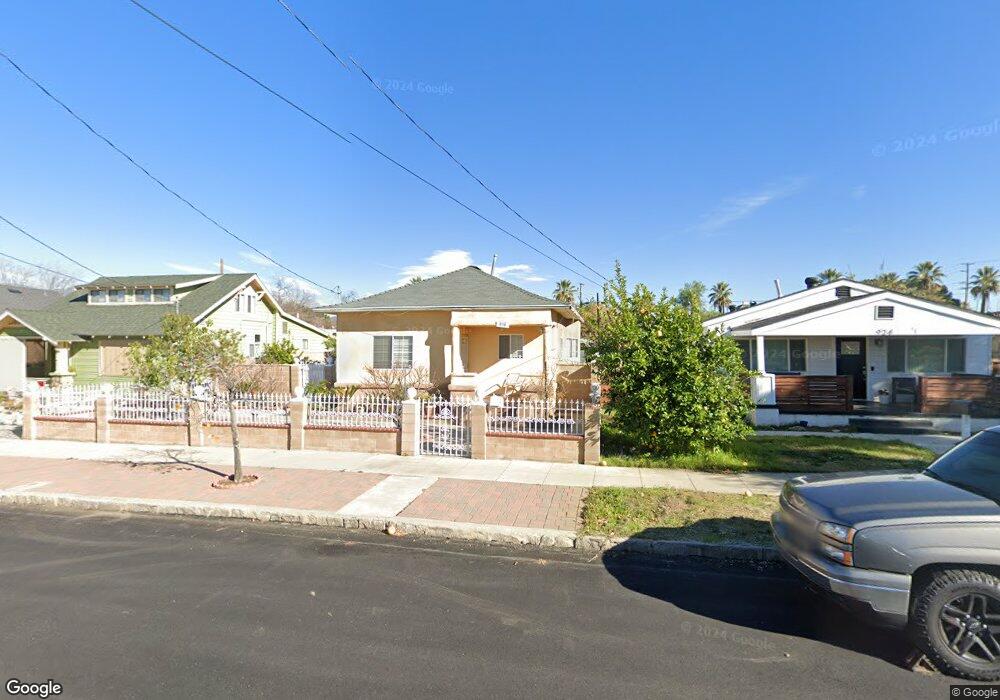
930 Clay St Redlands, CA 92374
North Redlands NeighborhoodEstimated Value: $408,000 - $446,000
2
Beds
1
Bath
1,088
Sq Ft
$389/Sq Ft
Est. Value
About This Home
This home is located at 930 Clay St, Redlands, CA 92374 and is currently estimated at $422,829, approximately $388 per square foot. 930 Clay St is a home located in San Bernardino County with nearby schools including Kimberly Elementary School, Moore Middle School, and Redlands East Valley High School.
Ownership History
Date
Name
Owned For
Owner Type
Purchase Details
Closed on
Oct 14, 2023
Sold by
Cervantes Jorge and Garibay Luz
Bought by
El Poso Living Trust
Current Estimated Value
Purchase Details
Closed on
Apr 13, 2010
Sold by
Cervantes Juan and Garibay Luz
Bought by
Cervantes Jorge and Garibay Luz
Purchase Details
Closed on
Jan 17, 2009
Sold by
Cervantes Juan and Cervantes Jorge
Bought by
Cervantes Juan and Garibay Luz
Purchase Details
Closed on
Jan 11, 2005
Sold by
Cervantes Jesus
Bought by
Cervantes Jorge and Cervantes Juan
Create a Home Valuation Report for This Property
The Home Valuation Report is an in-depth analysis detailing your home's value as well as a comparison with similar homes in the area
Home Values in the Area
Average Home Value in this Area
Purchase History
| Date | Buyer | Sale Price | Title Company |
|---|---|---|---|
| El Poso Living Trust | -- | None Listed On Document | |
| Cervantes Jorge | -- | None Available | |
| Cervantes Juan | -- | Orange Coast Title Company | |
| Cervantes Jorge | -- | -- |
Source: Public Records
Tax History
| Year | Tax Paid | Tax Assessment Tax Assessment Total Assessment is a certain percentage of the fair market value that is determined by local assessors to be the total taxable value of land and additions on the property. | Land | Improvement |
|---|---|---|---|---|
| 2025 | $1,517 | $119,241 | $41,889 | $77,352 |
| 2024 | $1,436 | $118,347 | $41,576 | $76,771 |
| 2023 | $1,434 | $116,027 | $40,761 | $75,266 |
| 2022 | $1,414 | $113,752 | $39,962 | $73,790 |
| 2021 | $1,439 | $111,521 | $39,178 | $72,343 |
| 2020 | $1,418 | $110,377 | $38,776 | $71,601 |
| 2019 | $1,379 | $108,213 | $38,016 | $70,197 |
| 2018 | $1,346 | $106,092 | $37,271 | $68,821 |
| 2017 | $1,335 | $104,012 | $36,540 | $67,472 |
| 2016 | $1,320 | $101,973 | $35,824 | $66,149 |
| 2015 | $1,311 | $100,441 | $35,286 | $65,155 |
| 2014 | $1,288 | $98,474 | $34,595 | $63,879 |
Source: Public Records
Map
Nearby Homes
- 903 Webster St
- 1103 Alta St
- 1144 Orange St
- 1203 Ohio St
- 1024 Lawton St
- 1003 Lawton St
- 1007 Lawton St
- 323 E Colton Ave
- 926 Texas St
- 887 Carlotta Ct
- 838 W Brockton Ave
- 915 Church St
- 610 E Lugonia Ave Unit 4
- 831 W Lugonia Ave
- 632 Church St
- 853 Railway Ln
- 873 Railway Ln
- 848 Railway Ln
- 167 N Center St
- 163 N Center St
Your Personal Tour Guide
Ask me questions while you tour the home.