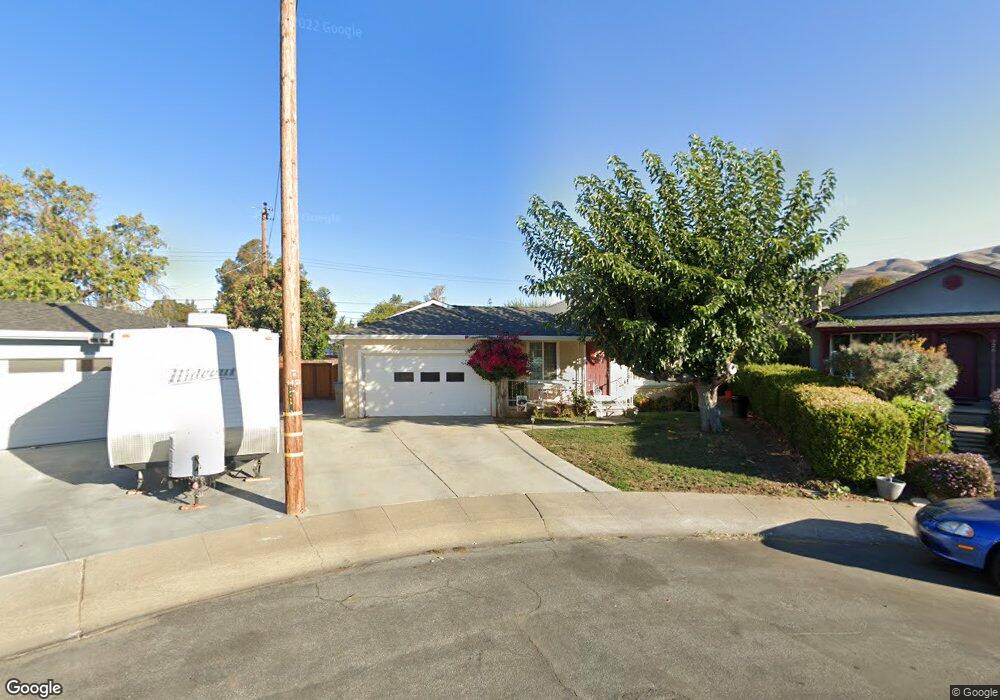
930 Dorian Ct San Jose, CA 95127
East Foothills NeighborhoodEstimated Value: $1,172,000 - $1,234,127
3
Beds
2
Baths
1,075
Sq Ft
$1,125/Sq Ft
Est. Value
About This Home
This home is located at 930 Dorian Ct, San Jose, CA 95127 and is currently estimated at $1,209,532, approximately $1,125 per square foot. 930 Dorian Ct is a home located in Santa Clara County with nearby schools including Toyon Elementary School, Piedmont Middle School, and Piedmont Hills High School.
Ownership History
Date
Name
Owned For
Owner Type
Purchase Details
Closed on
Apr 2, 2012
Sold by
Valencia Baldemar L and Valencia Maricela Cuevas
Bought by
Valencia Baldemar and Valencia Maricela Cuevas
Current Estimated Value
Home Financials for this Owner
Home Financials are based on the most recent Mortgage that was taken out on this home.
Original Mortgage
$276,000
Outstanding Balance
$36,131
Interest Rate
3.37%
Mortgage Type
FHA
Estimated Equity
$1,173,401
Purchase Details
Closed on
Jun 6, 1995
Sold by
Federal National Mortgage Association
Bought by
Valencia Baldemar L and Cuevas Maricela
Home Financials for this Owner
Home Financials are based on the most recent Mortgage that was taken out on this home.
Original Mortgage
$164,900
Interest Rate
7.92%
Mortgage Type
Seller Take Back
Purchase Details
Closed on
Feb 3, 1995
Sold by
Federal National Mortgage Association
Bought by
Federal National Mortgage Association
Create a Home Valuation Report for This Property
The Home Valuation Report is an in-depth analysis detailing your home's value as well as a comparison with similar homes in the area
Home Values in the Area
Average Home Value in this Area
Purchase History
| Date | Buyer | Sale Price | Title Company |
|---|---|---|---|
| Valencia Baldemar | -- | Old Republic Title Company | |
| Valencia Baldemar L | $170,000 | Old Republic Title Company | |
| Federal National Mortgage Association | $156,510 | -- |
Source: Public Records
Mortgage History
| Date | Status | Borrower | Loan Amount |
|---|---|---|---|
| Open | Valencia Baldemar | $276,000 | |
| Closed | Valencia Baldemar L | $164,900 |
Source: Public Records
Tax History
| Year | Tax Paid | Tax Assessment Tax Assessment Total Assessment is a certain percentage of the fair market value that is determined by local assessors to be the total taxable value of land and additions on the property. | Land | Improvement |
|---|---|---|---|---|
| 2025 | $5,906 | $350,416 | $128,140 | $222,276 |
| 2024 | $5,906 | $343,546 | $125,628 | $217,918 |
| 2023 | $5,775 | $336,811 | $123,165 | $213,646 |
| 2022 | $5,744 | $330,207 | $120,750 | $209,457 |
| 2021 | $5,535 | $323,733 | $118,383 | $205,350 |
| 2020 | $5,344 | $320,415 | $117,170 | $203,245 |
| 2019 | $5,137 | $314,133 | $114,873 | $199,260 |
| 2018 | $5,054 | $307,974 | $112,621 | $195,353 |
| 2017 | $5,067 | $301,936 | $110,413 | $191,523 |
| 2016 | $4,854 | $296,017 | $108,249 | $187,768 |
| 2015 | $4,792 | $291,571 | $106,623 | $184,948 |
| 2014 | $4,238 | $285,861 | $104,535 | $181,326 |
Source: Public Records
Map
Nearby Homes
- 3339 San Pablo Ave
- 914 Bard St
- 809 Gridley St
- 3309 Joanne Ave
- 3195 Kawalker Ln
- 3425 San Pablo Ave
- 3332 Pepper Tree Ln
- 3431 Golf Dr
- 723 Linda Flora St
- 706 Linda Vista St
- 14925 Joanne Ave
- 15001 Ridgetop Dr
- 662 Kirk Glen Dr
- 1137 Champagne Ln
- 757 Salt Lake Dr
- 4034 Holly Dr
- 2901 Glen Heather Dr
- 538 N White Rd
- 2811 Glen Firth Dr
- 444 Gridley St
Your Personal Tour Guide
Ask me questions while you tour the home.