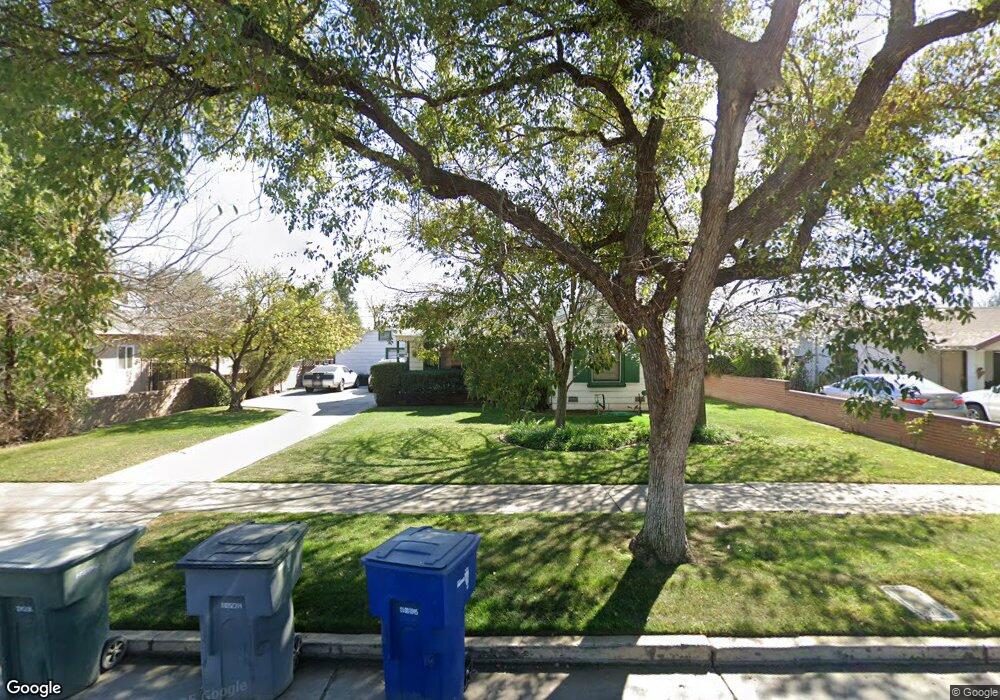
930 E Fountain Way Fresno, CA 93704
Maroa NeighborhoodEstimated Value: $277,000 - $350,000
2
Beds
2
Baths
1,003
Sq Ft
$313/Sq Ft
Est. Value
About This Home
This home is located at 930 E Fountain Way, Fresno, CA 93704 and is currently estimated at $314,388, approximately $313 per square foot. 930 E Fountain Way is a home located in Fresno County with nearby schools including Del Mar Elementary School, Fort Miller Middle School, and Fresno High School.
Ownership History
Date
Name
Owned For
Owner Type
Purchase Details
Closed on
Jul 23, 2001
Sold by
Allen Larry and Allen Evelyn
Bought by
Lowndes David C
Current Estimated Value
Home Financials for this Owner
Home Financials are based on the most recent Mortgage that was taken out on this home.
Original Mortgage
$78,300
Interest Rate
6.99%
Purchase Details
Closed on
Apr 2, 1999
Sold by
Brian Pifferini
Bought by
Allen Larry and Allen Evelyn
Home Financials for this Owner
Home Financials are based on the most recent Mortgage that was taken out on this home.
Original Mortgage
$55,800
Interest Rate
6.98%
Purchase Details
Closed on
Aug 4, 1994
Sold by
Calef Linda J
Bought by
Pifferini Brian
Home Financials for this Owner
Home Financials are based on the most recent Mortgage that was taken out on this home.
Original Mortgage
$70,650
Interest Rate
4.98%
Create a Home Valuation Report for This Property
The Home Valuation Report is an in-depth analysis detailing your home's value as well as a comparison with similar homes in the area
Home Values in the Area
Average Home Value in this Area
Purchase History
| Date | Buyer | Sale Price | Title Company |
|---|---|---|---|
| Lowndes David C | $87,000 | Chicago Title Co | |
| Allen Larry | $70,000 | First American Title Co | |
| Pifferini Brian | $79,000 | Stewart Title |
Source: Public Records
Mortgage History
| Date | Status | Borrower | Loan Amount |
|---|---|---|---|
| Previous Owner | Lowndes David C | $78,300 | |
| Previous Owner | Allen Larry | $55,800 | |
| Previous Owner | Pifferini Brian | $70,650 |
Source: Public Records
Tax History Compared to Growth
Tax History
| Year | Tax Paid | Tax Assessment Tax Assessment Total Assessment is a certain percentage of the fair market value that is determined by local assessors to be the total taxable value of land and additions on the property. | Land | Improvement |
|---|---|---|---|---|
| 2025 | $1,603 | $128,500 | $29,533 | $98,967 |
| 2023 | $1,510 | $123,512 | $28,387 | $95,125 |
| 2022 | $1,488 | $121,091 | $27,831 | $93,260 |
| 2021 | $1,446 | $118,718 | $27,286 | $91,432 |
| 2020 | $1,439 | $117,502 | $27,007 | $90,495 |
| 2019 | $1,383 | $115,199 | $26,478 | $88,721 |
| 2018 | $1,351 | $112,941 | $25,959 | $86,982 |
| 2017 | $1,327 | $110,727 | $25,450 | $85,277 |
| 2016 | $1,282 | $108,556 | $24,951 | $83,605 |
| 2015 | $1,261 | $106,927 | $24,577 | $82,350 |
| 2014 | $1,234 | $104,833 | $24,096 | $80,737 |
Source: Public Records
Map
Nearby Homes
- 3606 N College Ave
- 935 E Fedora Ave
- 1036 E Cornell Ave
- 1007 E Michigan Ave
- 1405 E Cortland Ave
- 1305 E Fedora Ave
- 3640 N Van Ness Blvd
- 1442 E Shields Ave
- 964 E Princeton Ave
- 1126 E Princeton Ave
- 1134 E Princeton Ave
- 1329 E Princeton Ave
- 840 E Brown Ave
- 1346 E Princeton Ave
- 1135 E Lansing Way
- 1020 E Saginaw Way
- 311 E Andrews Ave
- 1212 E Saginaw Way
- 625 E Lansing Way
- 311 E Dayton Ave
- 940 E Fountain Way
- 922 E Fountain Way
- 948 E Fountain Way
- 929 E Andrews Ave
- 939 E Andrews Ave
- 919 E Andrews Ave
- 906 E Fountain Way
- 1006 E Fountain Way
- 949 E Andrews Ave
- 911 E Andrews Ave
- 1003 E Andrews Ave
- 939 E Fountain Way
- 925 E Fountain Way
- 1014 E Fountain Way
- 947 E Fountain Way
- 1011 E Andrews Ave
- 955 E Fountain Way
- 909 E Fountain Way
- 1022 E Fountain Way
- 1019 E Andrews Ave