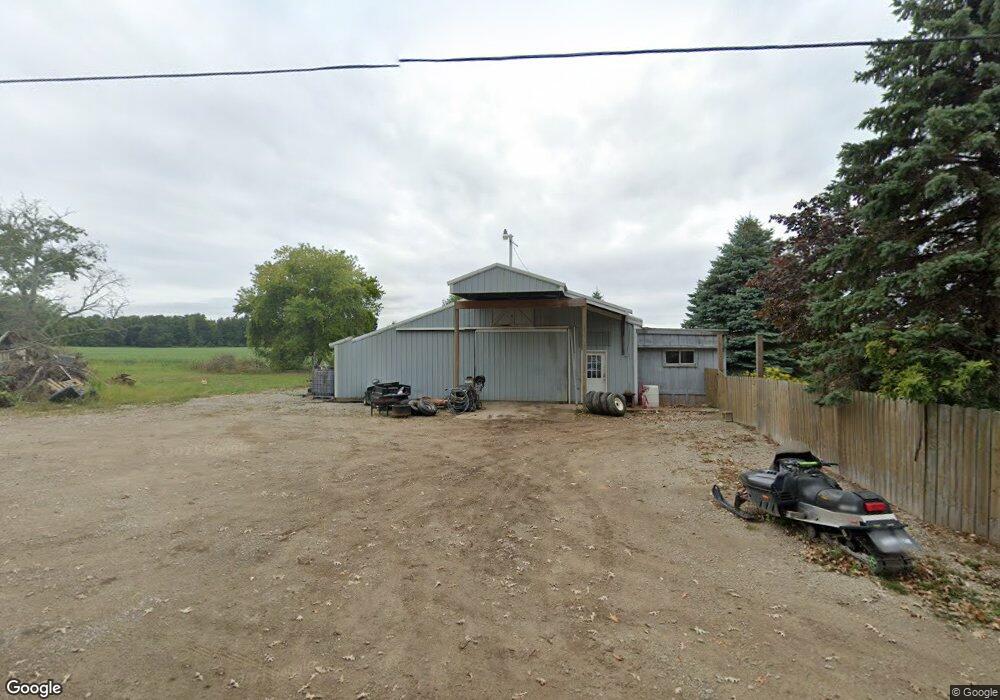
930 E Grand River Rd Williamston, MI 48895
Estimated Value: $222,000 - $317,000
3
Beds
2
Baths
1,800
Sq Ft
$154/Sq Ft
Est. Value
About This Home
This home is located at 930 E Grand River Rd, Williamston, MI 48895 and is currently estimated at $277,588, approximately $154 per square foot. 930 E Grand River Rd is a home located in Ingham County with nearby schools including Williamston Discovery Elementary School, Williamston Explorer Elementary School, and Williamston Middle School.
Ownership History
Date
Name
Owned For
Owner Type
Purchase Details
Closed on
Jul 15, 2025
Sold by
Kolenda Alexander and Kolenda Sara
Bought by
Kolenda Holdings Llc
Current Estimated Value
Purchase Details
Closed on
Oct 19, 2017
Sold by
Zenker Julie L and Schultz Julie L
Bought by
Charles Kolendda Sara Michelle and Charles Kolendda Alexander
Home Financials for this Owner
Home Financials are based on the most recent Mortgage that was taken out on this home.
Original Mortgage
$117,863
Interest Rate
3.83%
Purchase Details
Closed on
Dec 28, 2004
Sold by
Ross Velma L E and Ross Harry E
Bought by
Schultz Julie L
Home Financials for this Owner
Home Financials are based on the most recent Mortgage that was taken out on this home.
Original Mortgage
$107,600
Interest Rate
5%
Create a Home Valuation Report for This Property
The Home Valuation Report is an in-depth analysis detailing your home's value as well as a comparison with similar homes in the area
Home Values in the Area
Average Home Value in this Area
Purchase History
| Date | Buyer | Sale Price | Title Company |
|---|---|---|---|
| Kolenda Holdings Llc | -- | None Listed On Document | |
| Charles Kolendda Sara Michelle | $145,000 | Transnation Title Agency | |
| Schultz Julie L | $134,500 | Midstate |
Source: Public Records
Mortgage History
| Date | Status | Borrower | Loan Amount |
|---|---|---|---|
| Previous Owner | Charles Kolendda Sara Michelle | $117,863 | |
| Previous Owner | Schultz Julie L | $107,600 | |
| Closed | Schultz Julie L | $20,175 |
Source: Public Records
Tax History Compared to Growth
Tax History
| Year | Tax Paid | Tax Assessment Tax Assessment Total Assessment is a certain percentage of the fair market value that is determined by local assessors to be the total taxable value of land and additions on the property. | Land | Improvement |
|---|---|---|---|---|
| 2025 | $5,419 | $95,900 | $24,100 | $71,800 |
| 2024 | $5,059 | $95,900 | $24,100 | $71,800 |
| 2023 | $5,059 | $91,000 | $24,100 | $66,900 |
| 2022 | $4,843 | $85,200 | $22,200 | $63,000 |
| 2021 | $4,721 | $81,600 | $20,400 | $61,200 |
| 2020 | $4,564 | $77,300 | $20,400 | $56,900 |
| 2019 | $2,564 | $74,100 | $20,400 | $53,700 |
| 2018 | $4,327 | $70,000 | $18,200 | $51,800 |
| 2017 | $2,338 | $70,000 | $18,200 | $51,800 |
| 2016 | $2,319 | $68,200 | $17,900 | $50,300 |
| 2015 | -- | $65,300 | $35,868 | $29,432 |
| 2014 | -- | $53,800 | $35,868 | $17,932 |
Source: Public Records
Map
Nearby Homes
- 1235 Joann Ln
- 1020 Cherry Valle Ln
- 3620 Zimmer Rd
- 1340 E Grand River Rd
- 4347 Fruitbelt Ln
- 4350 Fruitbelt Ln
- 0 Beechwood Dr
- 15 Skipper Ln
- 26 Monarch Ln
- 109 Daggertail Ln
- 875 W Grand River Ave Unit 35
- 875 W Grand River Ave Unit 29
- 1544 E Sherwood Rd
- 540 W Grand River Ave
- 377 Linn Rd
- 345 Linn Rd
- 4400 Selwood Ct
- 346 Wind N Wood Dr
- 280 Winterberry Ln
- 29 Oliver Dr
- 954 E Grand River Ave
- 954 E Grand River Rd
- 885 E Grand River Rd
- 885 & 895 E Grand River Rd
- 885 & 895 E Grand River Ave
- 1000 E Grand
- 1000 E Grand River Rd
- 966 Glaser Rd
- 972 Glaser Rd
- 996 Glaser Rd
- 3725 Norris Rd
- 740 E Grand River Rd
- 1099 E Grand River Rd
- 1173 Joann Ln
- 1176 Joann Ln
- 1133 E Grand River Rd
- 1182 Joann Ln