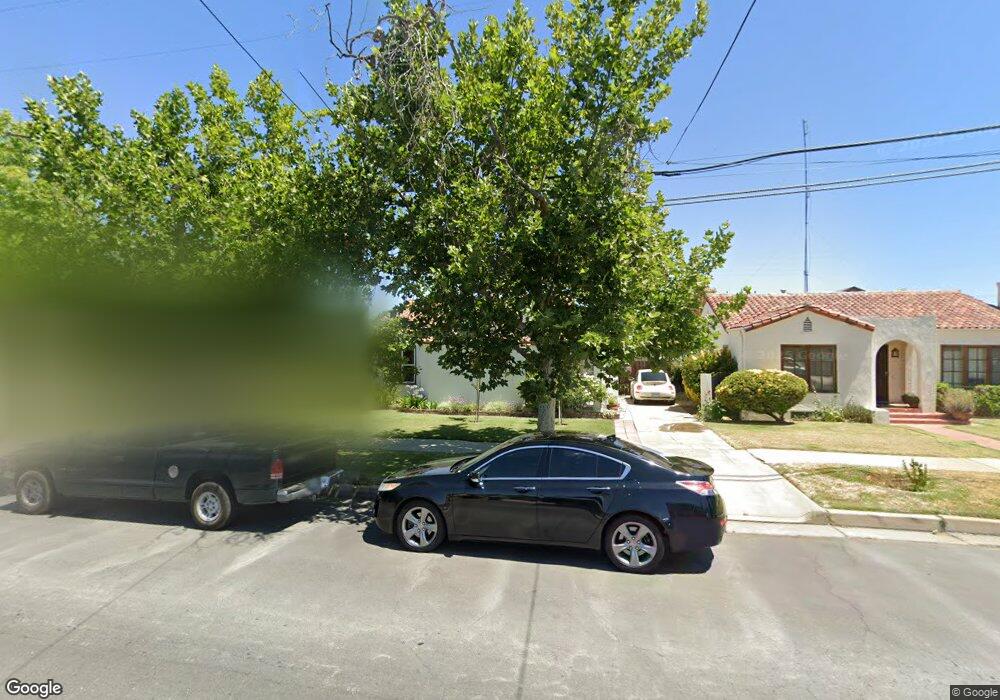
930 J St Los Banos, CA 93635
Estimated Value: $298,000 - $343,281
3
Beds
1
Bath
1,164
Sq Ft
$284/Sq Ft
Est. Value
About This Home
This home is located at 930 J St, Los Banos, CA 93635 and is currently estimated at $330,570, approximately $283 per square foot. 930 J St is a home located in Merced County with nearby schools including Los Banos Elementary School, Creekside Junior High School, and Los Banos High School.
Ownership History
Date
Name
Owned For
Owner Type
Purchase Details
Closed on
Nov 24, 2022
Sold by
Chavez Olffa R
Bought by
Olffa Chavez Family Trust
Current Estimated Value
Purchase Details
Closed on
Oct 26, 2012
Sold by
Tarte Roger G and Tarte Geraldine F
Bought by
Chavez Gilbert G and Chavez Olffa R
Home Financials for this Owner
Home Financials are based on the most recent Mortgage that was taken out on this home.
Original Mortgage
$83,460
Interest Rate
3.5%
Mortgage Type
FHA
Create a Home Valuation Report for This Property
The Home Valuation Report is an in-depth analysis detailing your home's value as well as a comparison with similar homes in the area
Home Values in the Area
Average Home Value in this Area
Purchase History
| Date | Buyer | Sale Price | Title Company |
|---|---|---|---|
| Olffa Chavez Family Trust | -- | -- | |
| Chavez Gilbert G | $85,000 | Transcounty Title Company |
Source: Public Records
Mortgage History
| Date | Status | Borrower | Loan Amount |
|---|---|---|---|
| Previous Owner | Chavez Gilbert G | $83,460 |
Source: Public Records
Tax History Compared to Growth
Tax History
| Year | Tax Paid | Tax Assessment Tax Assessment Total Assessment is a certain percentage of the fair market value that is determined by local assessors to be the total taxable value of land and additions on the property. | Land | Improvement |
|---|---|---|---|---|
| 2025 | $1,088 | $104,657 | $16,001 | $88,656 |
| 2024 | $1,088 | $102,606 | $15,688 | $86,918 |
| 2023 | $1,026 | $100,595 | $15,381 | $85,214 |
| 2022 | $1,009 | $98,624 | $15,080 | $83,544 |
| 2021 | $998 | $96,691 | $14,785 | $81,906 |
| 2020 | $985 | $95,701 | $14,634 | $81,067 |
| 2019 | $966 | $93,826 | $14,348 | $79,478 |
| 2018 | $935 | $91,987 | $14,067 | $77,920 |
| 2017 | $923 | $90,185 | $13,792 | $76,393 |
| 2016 | $932 | $88,418 | $13,522 | $74,896 |
| 2015 | $912 | $87,090 | $13,319 | $73,771 |
| 2014 | $886 | $85,385 | $13,059 | $72,326 |
Source: Public Records
Map
Nearby Homes