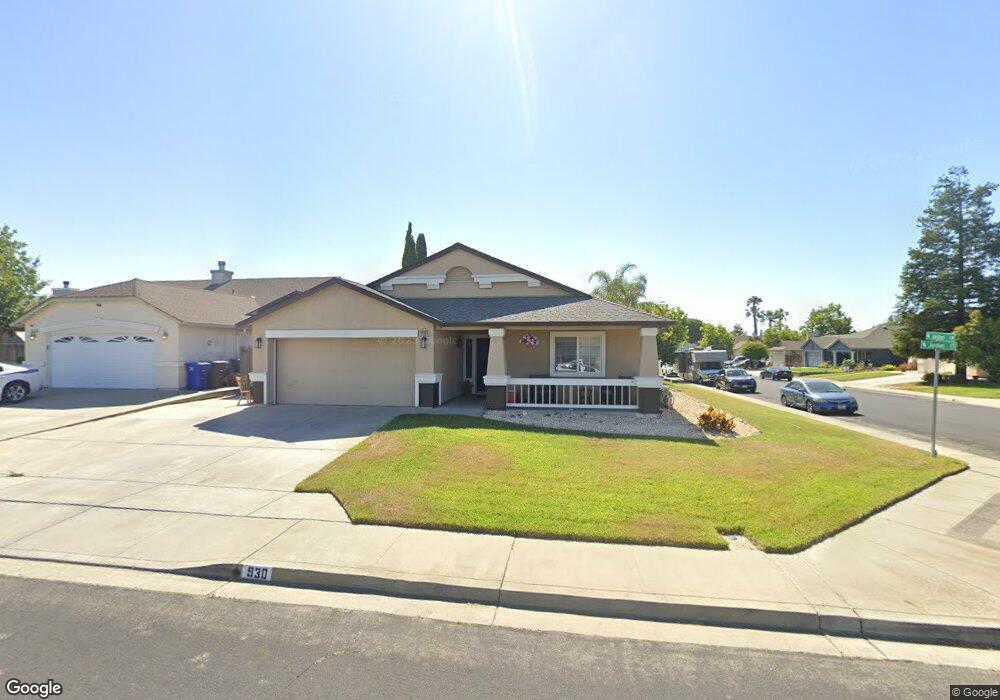
930 Jordan Ct Oakley, CA 94561
Estimated Value: $590,000 - $627,000
3
Beds
2
Baths
1,402
Sq Ft
$432/Sq Ft
Est. Value
About This Home
This home is located at 930 Jordan Ct, Oakley, CA 94561 and is currently estimated at $606,144, approximately $432 per square foot. 930 Jordan Ct is a home located in Contra Costa County with nearby schools including Vintage Parkway Elementary School, Delta Vista Middle School, and Freedom High School.
Ownership History
Date
Name
Owned For
Owner Type
Purchase Details
Closed on
Apr 13, 2007
Sold by
Burrows Jeffrey Clifton
Bought by
Burrows Jeffrey Clifton and Landry Nancy L
Current Estimated Value
Home Financials for this Owner
Home Financials are based on the most recent Mortgage that was taken out on this home.
Original Mortgage
$20,000
Outstanding Balance
$12,059
Interest Rate
6.1%
Mortgage Type
Stand Alone Second
Estimated Equity
$594,085
Purchase Details
Closed on
Nov 17, 1998
Sold by
Oakley Avalon Lp
Bought by
Burrows Jeffrey Clifton
Home Financials for this Owner
Home Financials are based on the most recent Mortgage that was taken out on this home.
Original Mortgage
$127,988
Outstanding Balance
$27,520
Interest Rate
6.42%
Mortgage Type
Purchase Money Mortgage
Estimated Equity
$578,624
Create a Home Valuation Report for This Property
The Home Valuation Report is an in-depth analysis detailing your home's value as well as a comparison with similar homes in the area
Home Values in the Area
Average Home Value in this Area
Purchase History
| Date | Buyer | Sale Price | Title Company |
|---|---|---|---|
| Burrows Jeffrey Clifton | -- | Accommodation | |
| Burrows Jeffrey Clifton | $160,000 | Old Republic Title Company |
Source: Public Records
Mortgage History
| Date | Status | Borrower | Loan Amount |
|---|---|---|---|
| Open | Burrows Jeffrey Clifton | $20,000 | |
| Open | Burrows Jeffrey Clifton | $127,988 |
Source: Public Records
Tax History Compared to Growth
Tax History
| Year | Tax Paid | Tax Assessment Tax Assessment Total Assessment is a certain percentage of the fair market value that is determined by local assessors to be the total taxable value of land and additions on the property. | Land | Improvement |
|---|---|---|---|---|
| 2025 | $4,165 | $293,524 | $50,152 | $243,372 |
| 2024 | $4,121 | $287,769 | $49,169 | $238,600 |
| 2023 | $4,121 | $282,127 | $48,205 | $233,922 |
| 2022 | $4,090 | $276,596 | $47,260 | $229,336 |
| 2021 | $4,016 | $271,174 | $46,334 | $224,840 |
| 2019 | $3,764 | $263,132 | $44,960 | $218,172 |
| 2018 | $3,672 | $257,974 | $44,079 | $213,895 |
| 2017 | $3,642 | $252,916 | $43,215 | $209,701 |
| 2016 | $3,458 | $247,958 | $42,368 | $205,590 |
| 2015 | $3,477 | $244,234 | $41,732 | $202,502 |
| 2014 | $3,434 | $239,451 | $40,915 | $198,536 |
Source: Public Records
Map
Nearby Homes
- 201 Ohara Ave
- 1126 Deerpark Rd
- 9999 7th St
- 336 Lakespring Place
- 321 Lakespring Place
- 0 Almond Dr Unit 41106452
- 4670 Fuschia Way
- 5053 Miguel Dr
- 0 Main St Unit 41115212
- 4545 Waterford Way
- 1384 Rutherford Ln
- 521 Freemark Ln
- 317 Lorenz Dr
- 210 W Cypress Rd Unit 27
- 210 W Cypress Rd Unit 1
- 354 Hazelnut Ln
- 881 Chianti Way
- 3901-B Rose Ave
- 876 Diamante Way
- 736 Walnut Ranch Way