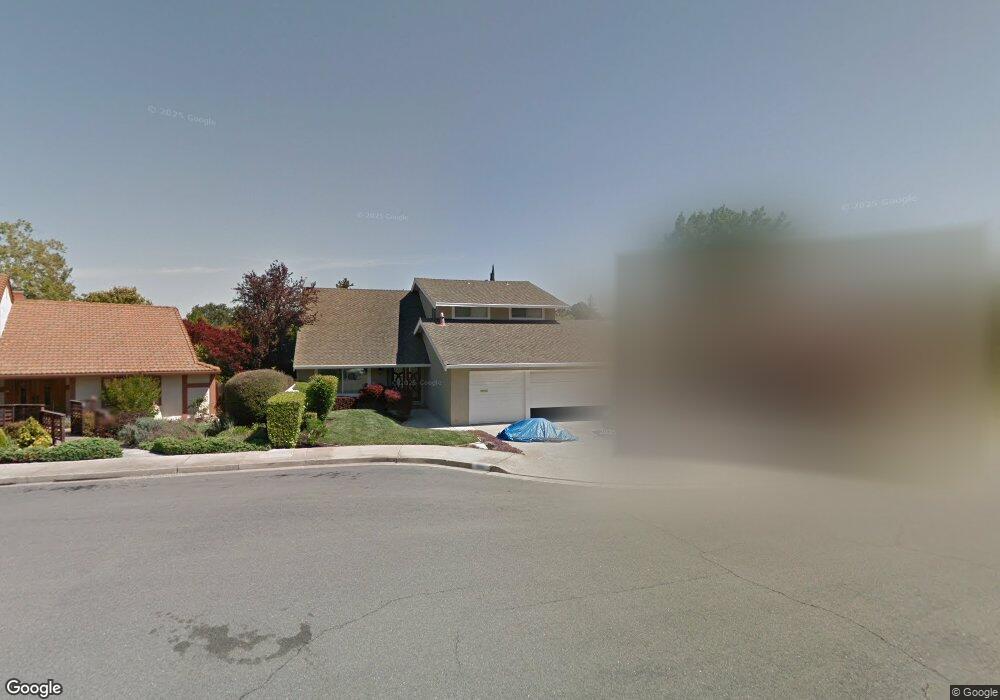
930 Kenilworth Ct Walnut Creek, CA 94596
Estimated Value: $1,775,000 - $1,965,000
6
Beds
3
Baths
2,604
Sq Ft
$702/Sq Ft
Est. Value
About This Home
This home is located at 930 Kenilworth Ct, Walnut Creek, CA 94596 and is currently estimated at $1,829,291, approximately $702 per square foot. 930 Kenilworth Ct is a home located in Contra Costa County with nearby schools including Murwood Elementary School, Walnut Creek Intermediate School, and Las Lomas High School.
Ownership History
Date
Name
Owned For
Owner Type
Purchase Details
Closed on
Jun 13, 2013
Sold by
Orgain Stephen
Bought by
Swenson Robert W and Swenson Michelle
Current Estimated Value
Home Financials for this Owner
Home Financials are based on the most recent Mortgage that was taken out on this home.
Original Mortgage
$727,500
Outstanding Balance
$514,958
Interest Rate
3.38%
Mortgage Type
New Conventional
Estimated Equity
$1,314,333
Purchase Details
Closed on
Nov 11, 2002
Sold by
Burley Michael N and Burley Elizabeth
Bought by
Orgain Stephen
Home Financials for this Owner
Home Financials are based on the most recent Mortgage that was taken out on this home.
Original Mortgage
$307,100
Interest Rate
4.87%
Mortgage Type
Purchase Money Mortgage
Purchase Details
Closed on
Aug 22, 2000
Sold by
Bond James D and Meyer Alida
Bought by
Burley Michael N and Burley Elizabeth
Home Financials for this Owner
Home Financials are based on the most recent Mortgage that was taken out on this home.
Original Mortgage
$471,800
Interest Rate
8.29%
Mortgage Type
Purchase Money Mortgage
Purchase Details
Closed on
Nov 11, 1999
Sold by
Bond James D and Meyer Alida
Bought by
Bond James D and Bond Alida Meyer
Create a Home Valuation Report for This Property
The Home Valuation Report is an in-depth analysis detailing your home's value as well as a comparison with similar homes in the area
Home Values in the Area
Average Home Value in this Area
Purchase History
| Date | Buyer | Sale Price | Title Company |
|---|---|---|---|
| Swenson Robert W | $970,000 | Fidelity National Title Co | |
| Orgain Stephen | $649,500 | First American Title | |
| Orgain Stephen | -- | First American Title | |
| Burley Michael N | $590,000 | Placer Title Company | |
| Bond James D | -- | -- |
Source: Public Records
Mortgage History
| Date | Status | Borrower | Loan Amount |
|---|---|---|---|
| Open | Swenson Robert W | $727,500 | |
| Previous Owner | Orgain Stephen | $307,100 | |
| Previous Owner | Burley Michael N | $471,800 |
Source: Public Records
Tax History Compared to Growth
Tax History
| Year | Tax Paid | Tax Assessment Tax Assessment Total Assessment is a certain percentage of the fair market value that is determined by local assessors to be the total taxable value of land and additions on the property. | Land | Improvement |
|---|---|---|---|---|
| 2025 | $14,074 | $1,194,473 | $738,852 | $455,621 |
| 2024 | $13,741 | $1,171,053 | $724,365 | $446,688 |
| 2023 | $13,741 | $1,148,092 | $710,162 | $437,930 |
| 2022 | $13,438 | $1,125,582 | $696,238 | $429,344 |
| 2021 | $13,076 | $1,103,513 | $682,587 | $420,926 |
| 2019 | $12,816 | $1,070,784 | $662,342 | $408,442 |
| 2018 | $12,383 | $1,049,789 | $649,355 | $400,434 |
| 2017 | $12,160 | $1,029,206 | $636,623 | $392,583 |
| 2016 | $11,939 | $1,009,027 | $624,141 | $384,886 |
| 2015 | $11,670 | $993,871 | $614,766 | $379,105 |
| 2014 | $11,541 | $974,403 | $602,724 | $371,679 |
Source: Public Records
Map
Nearby Homes
- 1092 Hillendale Ct
- 2129 Youngs Ct
- 421 Twin Oaks Ln
- 32 Pacer Place
- 31 Arabian Ct
- 628 Sugarloaf Ct
- 172 Rudgear Dr
- 1096 Mountain View Blvd
- 1305 Chesterton Way
- 189 Rudgear Dr
- 2409 Lavender Dr
- 2128 San Miguel Dr
- 1080 Scots Ln
- 4 Brookdale Ct
- 1101 Scots Ln
- 2673 Velvet Way
- 1555 Pebblebrook Ct
- 1310 Creekside Dr Unit 303
- 2101 Hillview Dr
- 25 Adeline Dr
- 940 Kenilworth Ct
- 920 Kenilworth Ct
- 933 Reddington Ct
- 923 Reddington Ct
- 952 Kenilworth Ct
- 943 Reddington Ct
- 941 Kenilworth Ct
- 931 Kenilworth Ct
- 910 Kenilworth Ct
- 921 Kenilworth Ct
- 913 Reddington Ct
- 951 Kenilworth Ct
- 901 Kenilworth Ct
- 962 Kenilworth Ct
- 953 Reddington Ct
- 911 Kenilworth Ct
- 961 Kenilworth Ct
- 932 Reddington Ct
- 903 Reddington Ct
- 922 Reddington Ct