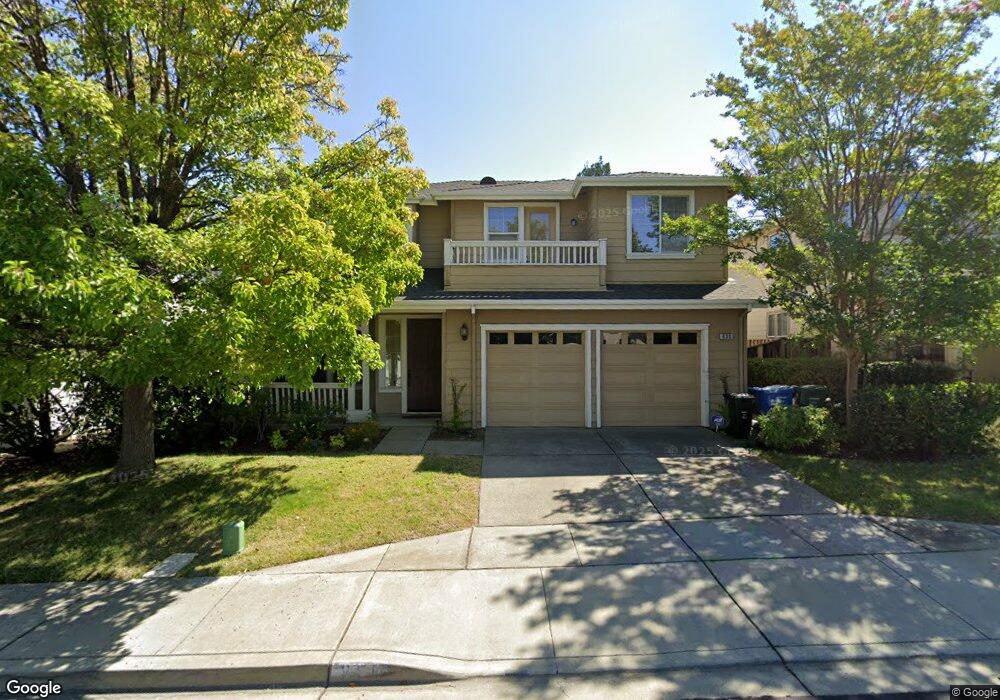
930 Monet Cir Walnut Creek, CA 94597
Larkey Park NeighborhoodEstimated Value: $1,254,668 - $1,550,000
3
Beds
3
Baths
2,371
Sq Ft
$603/Sq Ft
Est. Value
About This Home
This home is located at 930 Monet Cir, Walnut Creek, CA 94597 and is currently estimated at $1,429,417, approximately $602 per square foot. 930 Monet Cir is a home located in Contra Costa County with nearby schools including Pleasant Hill Elementary School, Pleasant Hill Middle School, and College Park High School.
Ownership History
Date
Name
Owned For
Owner Type
Purchase Details
Closed on
Mar 18, 2021
Sold by
Yu Peter C and Li Joyce W
Bought by
Yu Peter C and Li Joyce W
Current Estimated Value
Purchase Details
Closed on
Nov 30, 2012
Sold by
Yu Peter C and Li Joyce W
Bought by
Yu Peter C and Li Joyce W
Home Financials for this Owner
Home Financials are based on the most recent Mortgage that was taken out on this home.
Original Mortgage
$382,000
Interest Rate
3.35%
Mortgage Type
New Conventional
Purchase Details
Closed on
Oct 23, 2000
Sold by
Ponderosa Homes Inc
Bought by
Yu Peter C and Li Joyce W
Home Financials for this Owner
Home Financials are based on the most recent Mortgage that was taken out on this home.
Original Mortgage
$320,000
Interest Rate
7.87%
Mortgage Type
Purchase Money Mortgage
Create a Home Valuation Report for This Property
The Home Valuation Report is an in-depth analysis detailing your home's value as well as a comparison with similar homes in the area
Home Values in the Area
Average Home Value in this Area
Purchase History
| Date | Buyer | Sale Price | Title Company |
|---|---|---|---|
| Yu Peter C | -- | None Listed On Document | |
| Yu Peter C | -- | Fidelity National Title Co | |
| Yu Peter C | $493,000 | First American Title Guarant |
Source: Public Records
Mortgage History
| Date | Status | Borrower | Loan Amount |
|---|---|---|---|
| Previous Owner | Yu Peter C | $382,000 | |
| Previous Owner | Yu Peter C | $320,000 |
Source: Public Records
Tax History
| Year | Tax Paid | Tax Assessment Tax Assessment Total Assessment is a certain percentage of the fair market value that is determined by local assessors to be the total taxable value of land and additions on the property. | Land | Improvement |
|---|---|---|---|---|
| 2025 | $9,005 | $742,703 | $376,701 | $366,002 |
| 2024 | $8,647 | $728,141 | $369,315 | $358,826 |
| 2023 | $8,647 | $713,865 | $362,074 | $351,791 |
| 2022 | $8,571 | $699,869 | $354,975 | $344,894 |
| 2021 | $8,377 | $686,147 | $348,015 | $338,132 |
| 2019 | $8,192 | $665,797 | $337,694 | $328,103 |
| 2018 | $7,895 | $652,743 | $331,073 | $321,670 |
| 2017 | $7,642 | $639,945 | $324,582 | $315,363 |
| 2016 | $7,457 | $627,398 | $318,218 | $309,180 |
| 2015 | $7,401 | $617,975 | $313,439 | $304,536 |
| 2014 | $7,301 | $605,871 | $307,300 | $298,571 |
Source: Public Records
Map
Nearby Homes
- 942 Monet Cir
- 156 Pioneer Ave
- 1539 Geary Rd Unit C
- 1747 1st Ave
- 1077 Wesley Ct Unit 7
- 1089 Wesley Ct Unit 8
- 160 Via Del Sol
- 2742 Jones Rd
- 132 Oak Cir
- 2780 Jones Rd
- 2640 Jones Rd Unit A
- 780 Quiet View Ct Unit A
- 2721 Oak Rd Unit L
- 2650 Jones Rd Unit 14
- 1594 Morgan Ln
- 1622 San Luis Rd
- 214 Oak Cir
- 224 Oak Cir
- 194 Oak Cir
- 236 Oak Cir
Your Personal Tour Guide
Ask me questions while you tour the home.