
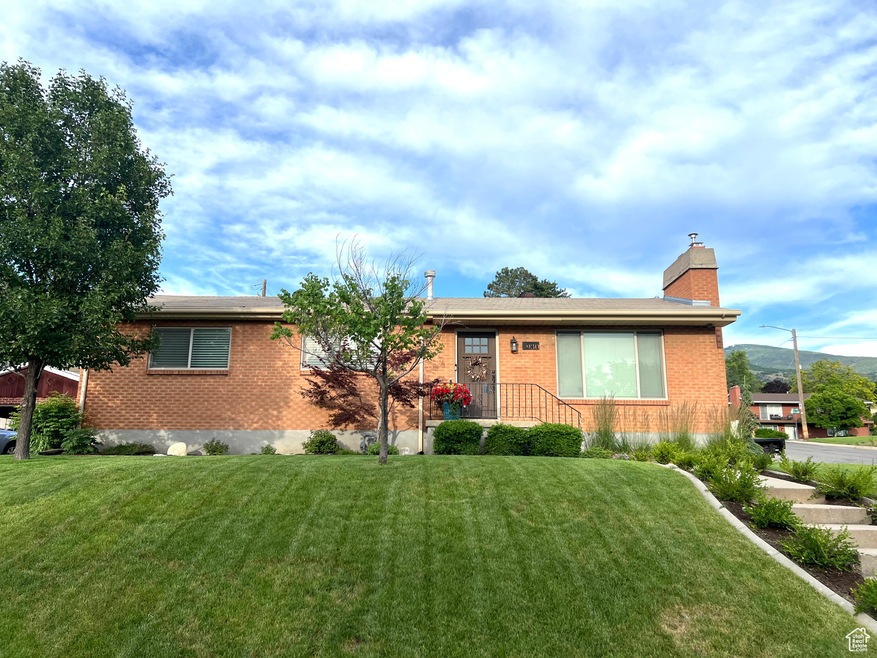
930 N 650 E Bountiful, UT 84010
Estimated payment $3,513/month
Total Views
1,547
5
Beds
2
Baths
2,256
Sq Ft
$261
Price per Sq Ft
Highlights
- RV or Boat Parking
- Updated Kitchen
- Valley View
- Viewmont High School Rated A-
- Secluded Lot
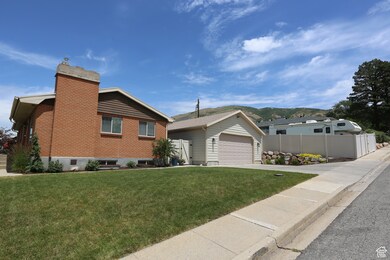
- Rambler Architecture
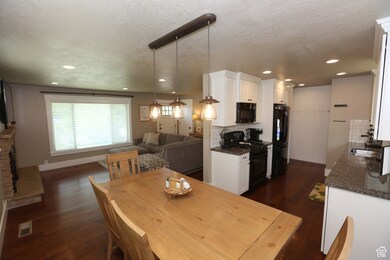
About This Home
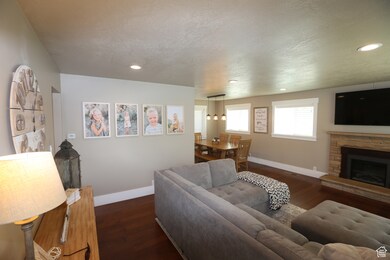
Stunning, fully updated Bountiful East Bench home! This move-in-ready gem features new electrical, plumbing, heating, vinyl windows, and water heater. Enjoy newer appliances, fresh paint, modern floor coverings, sleek quartz countertops, a storage shed, covered patio, and a spacious 2-car garage with workbench and ample storage. The finished basement boasts a cozy family room with gas fireplace, play area, built-in desk/study space, and a bathroom with shower. Nestled on a large, fully fenced lot, this home offers privacy and is within walking distance to an elementary school and scenic hiking trails. Perfectly located for convenience and outdoor enthusiasts! Square footage is a courtesy estimate from county records; buyer to verify independently.
Listing Agent
Kristin Peterson
White Oak Real Estate, LLC. License #14185200 Listed on: 06/13/2025
Home Details
Home Type
- Single Family
Est. Annual Taxes
- $2,875
Year Built
- Built in 1955
Lot Details
- 9,583 Sq Ft Lot
- Property is Fully Fenced
- Landscaped
- Secluded Lot
- Corner Lot
- Terraced Lot
- Sprinkler System
- Vegetable Garden
- Property is zoned Single-Family
Parking
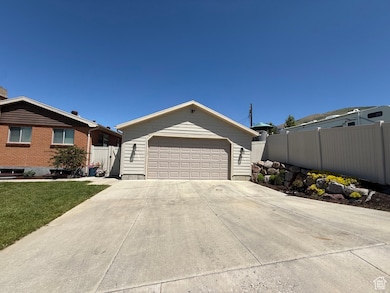
- 2 Car Garage
- RV or Boat Parking
Home Design
- Rambler Architecture
- Brick Exterior Construction
- Pitched Roof
Interior Spaces
- 2,256 Sq Ft Home
- 2-Story Property
- Ceiling Fan
- 2 Fireplaces
- Gas Log Fireplace
- Double Pane Windows
- Blinds
- Valley Views
- Basement Fills Entire Space Under The House
- Electric Dryer Hookup
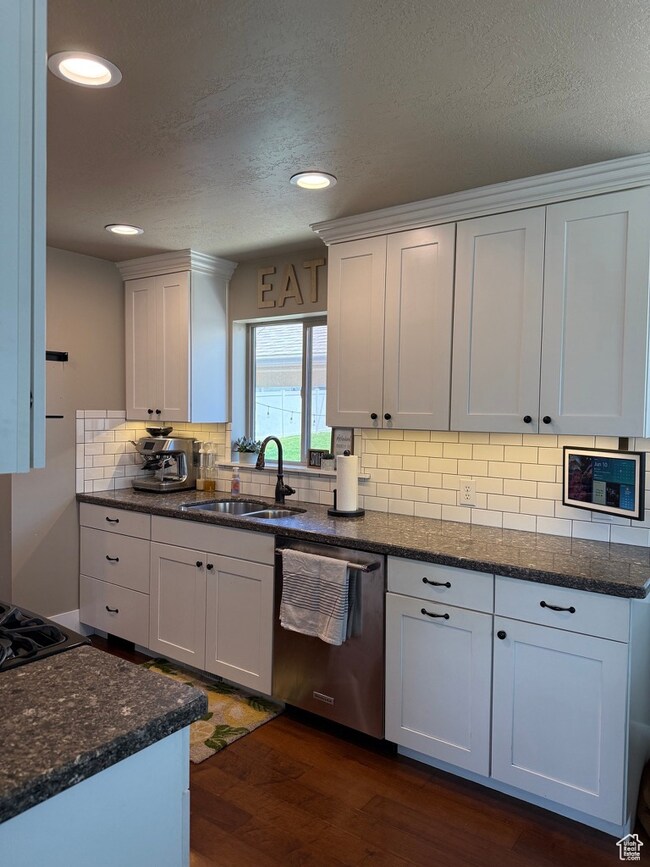
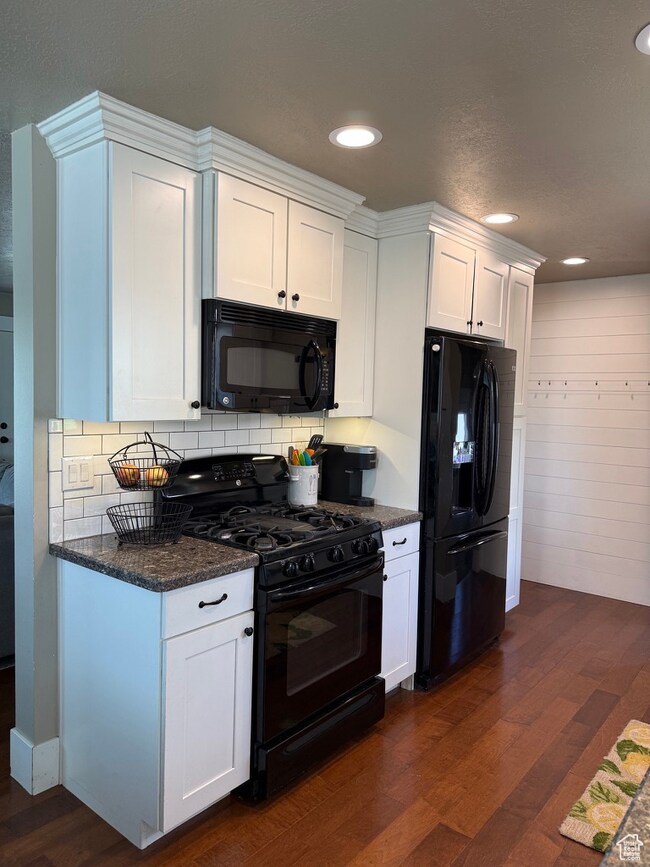
Kitchen
- Updated Kitchen
- Gas Oven
- Gas Range
- Free-Standing Range
- Microwave
- Portable Dishwasher
- Granite Countertops
- Disposal
Flooring
- Carpet
- Laminate
- Tile
Bedrooms and Bathrooms
- 5 Bedrooms | 3 Main Level Bedrooms
- Primary Bedroom on Main
Outdoor Features
- Covered patio or porch
- Storage Shed
- Outbuilding
Schools
- Tolman Elementary School
- Bountiful Middle School
- Viewmont High School
Utilities
- Forced Air Heating and Cooling System
- Natural Gas Connected
Community Details
- No Home Owners Association
- Hillside Subdivision
Listing and Financial Details
- Exclusions: Dryer, Gas Grill/BBQ, Washer, Trampoline, Video Door Bell(s), Video Camera(s)
- Assessor Parcel Number 04-005-0088
Map
Create a Home Valuation Report for This Property
The Home Valuation Report is an in-depth analysis detailing your home's value as well as a comparison with similar homes in the area
Home Values in the Area
Average Home Value in this Area
Tax History
| Year | Tax Paid | Tax Assessment Tax Assessment Total Assessment is a certain percentage of the fair market value that is determined by local assessors to be the total taxable value of land and additions on the property. | Land | Improvement |
|---|---|---|---|---|
| 2024 | $2,876 | $270,600 | $114,006 | $156,594 |
| 2023 | $2,853 | $488,000 | $205,997 | $282,003 |
| 2022 | $3,023 | $284,350 | $109,592 | $174,758 |
| 2021 | $2,790 | $402,000 | $162,824 | $239,176 |
| 2020 | $2,438 | $352,000 | $148,276 | $203,724 |
| 2019 | $2,227 | $312,000 | $147,658 | $164,342 |
| 2018 | $1,923 | $263,000 | $136,948 | $126,052 |
| 2016 | $1,555 | $114,455 | $43,088 | $71,367 |
| 2015 | $1,545 | $107,470 | $43,088 | $64,382 |
| 2014 | $1,460 | $104,259 | $43,088 | $61,171 |
| 2013 | -- | $92,230 | $41,748 | $50,482 |
Source: Public Records
Property History
| Date | Event | Price | Change | Sq Ft Price |
|---|---|---|---|---|
| 06/13/2025 06/13/25 | For Sale | $589,900 | -- | $261 / Sq Ft |
Source: UtahRealEstate.com
Purchase History
| Date | Type | Sale Price | Title Company |
|---|---|---|---|
| Warranty Deed | -- | North American Title | |
| Warranty Deed | -- | North American Title Llc | |
| Warranty Deed | -- | None Available |
Source: Public Records
Mortgage History
| Date | Status | Loan Amount | Loan Type |
|---|---|---|---|
| Open | $308,100 | New Conventional | |
| Closed | $303,300 | New Conventional | |
| Previous Owner | $120,000 | New Conventional | |
| Previous Owner | $146,775 | New Conventional |
Source: Public Records
Similar Homes in Bountiful, UT
Source: UtahRealEstate.com
MLS Number: 2092129
APN: 04-005-0088
Disclaimer: Certain information contained herein is derived from information provided by parties other than Homes.com. All information provided is deemed reliable, but is not guaranteed to be accurate and should be independently verified.
![]() IDX information is provided exclusively for consumers’ personal, non-commercial use, that it may not be used for any purpose other than to identify prospective properties consumers may be interested in purchasing, and that the data is deemed reliable but is not guaranteed accurate by the MLS. Licensor is only providing the MLS Content and not other sources of data provided in the Product.
IDX information is provided exclusively for consumers’ personal, non-commercial use, that it may not be used for any purpose other than to identify prospective properties consumers may be interested in purchasing, and that the data is deemed reliable but is not guaranteed accurate by the MLS. Licensor is only providing the MLS Content and not other sources of data provided in the Product.
Based on information from the Wasatch Front Regional Multiple Listing Service, Inc.. All data, including all measurements and calculations of area, is obtained from various sources and has not been, and will not be, verified by broker or the MLS. All information should be independently reviewed and verified for accuracy. Properties may or may not be listed by the office/agent presenting the information.
Nearby Homes
- 638 E 1050 N
- 864 N 750 E
- 1195 N 400 E
- 1392 N 450 E
- 399 E 400 N Unit 2A
- 908 Northern Hills Dr
- 1414 N 325 E
- 302 E 1400 N
- 149 E 800 N
- 263 E 1350 N
- 267 N 300 E
- 104 E 650 N
- 189 E 1200 S
- 735 E 850 S
- 81 S 700 E
- 698 Northridge Dr
- 17 E 400 N Unit 27C
- 22 W Orchard Ln Unit 202
- 1289 N Bountiful Chase
- 1375 Northridge Dr