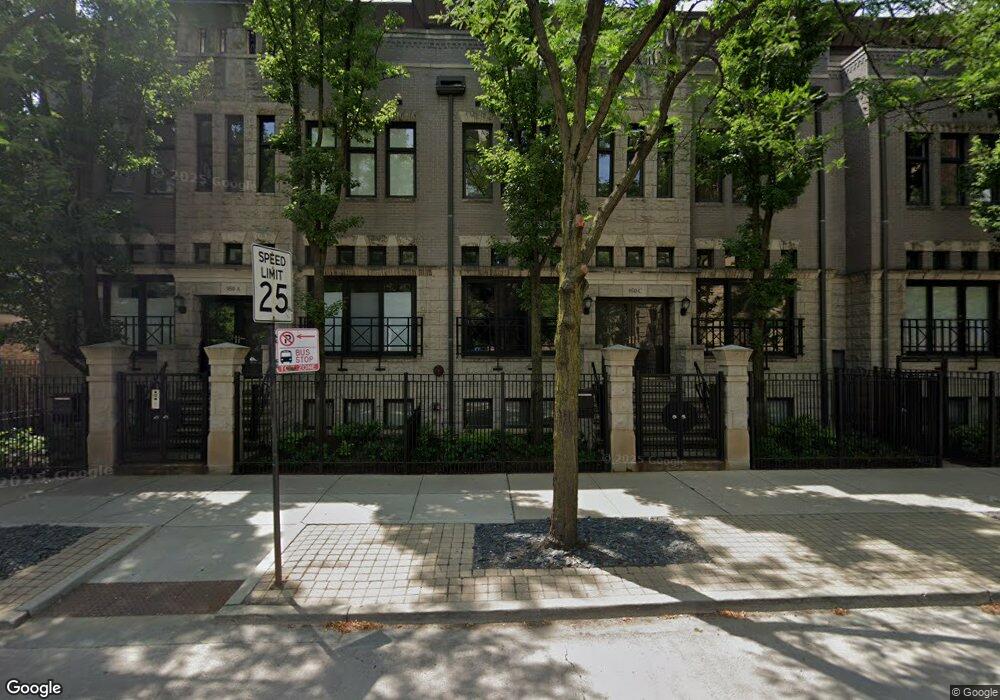
930 N Clark St Unit 31C Chicago, IL 60610
River North NeighborhoodEstimated Value: $611,000 - $815,000
--
Bed
--
Bath
--
Sq Ft
1.56
Acres
About This Home
This home is located at 930 N Clark St Unit 31C, Chicago, IL 60610 and is currently estimated at $728,624. 930 N Clark St Unit 31C is a home located in Cook County with nearby schools including Ogden Elementary School, Wells Community Academy High School, and Frances Xavier Warde School.
Ownership History
Date
Name
Owned For
Owner Type
Purchase Details
Closed on
Apr 2, 2004
Sold by
Phelan Janet L
Bought by
Phelan Janet L and Janet L Phelan Living Trust
Current Estimated Value
Purchase Details
Closed on
Oct 14, 1999
Sold by
Shapira Laura
Bought by
Phelan Janet L
Home Financials for this Owner
Home Financials are based on the most recent Mortgage that was taken out on this home.
Original Mortgage
$292,500
Interest Rate
7.78%
Purchase Details
Closed on
Nov 21, 1997
Sold by
Corus Bank Na
Bought by
Shapira Laura
Home Financials for this Owner
Home Financials are based on the most recent Mortgage that was taken out on this home.
Original Mortgage
$272,000
Interest Rate
7.37%
Purchase Details
Closed on
Mar 1, 1995
Sold by
Oakclub Ltd Partnership
Bought by
Dinallo Biagino and Dinallo Germana
Home Financials for this Owner
Home Financials are based on the most recent Mortgage that was taken out on this home.
Original Mortgage
$140,000
Interest Rate
9%
Create a Home Valuation Report for This Property
The Home Valuation Report is an in-depth analysis detailing your home's value as well as a comparison with similar homes in the area
Home Values in the Area
Average Home Value in this Area
Purchase History
| Date | Buyer | Sale Price | Title Company |
|---|---|---|---|
| Phelan Janet L | -- | -- | |
| Phelan Janet L | $390,000 | -- | |
| Shapira Laura | $340,000 | -- | |
| Dinallo Biagino | $290,000 | -- |
Source: Public Records
Mortgage History
| Date | Status | Borrower | Loan Amount |
|---|---|---|---|
| Closed | Phelan Janet L | $292,500 | |
| Previous Owner | Shapira Laura | $272,000 | |
| Previous Owner | Dinallo Biagino | $140,000 |
Source: Public Records
Tax History Compared to Growth
Tax History
| Year | Tax Paid | Tax Assessment Tax Assessment Total Assessment is a certain percentage of the fair market value that is determined by local assessors to be the total taxable value of land and additions on the property. | Land | Improvement |
|---|---|---|---|---|
| 2024 | $11,649 | $59,756 | $23,638 | $36,118 |
| 2023 | $11,334 | $58,527 | $19,032 | $39,495 |
| 2022 | $11,334 | $58,527 | $19,032 | $39,495 |
| 2021 | $11,099 | $58,526 | $19,032 | $39,494 |
| 2020 | $11,860 | $56,342 | $13,322 | $43,020 |
| 2019 | $11,595 | $61,140 | $13,322 | $47,818 |
| 2018 | $11,399 | $61,140 | $13,322 | $47,818 |
| 2017 | $12,220 | $60,141 | $10,658 | $49,483 |
| 2016 | $11,545 | $60,141 | $10,658 | $49,483 |
| 2015 | $10,540 | $60,141 | $10,658 | $49,483 |
| 2014 | $8,764 | $49,806 | $8,564 | $41,242 |
| 2013 | $8,580 | $49,806 | $8,564 | $41,242 |
Source: Public Records
Map
Nearby Homes
- 111 W Maple St Unit 1805
- 915 N Dearborn St
- 30 W Oak St Unit 5E
- 55 W Delaware Place Unit 1011
- 55 W Delaware Place Unit 221
- 55 W Delaware Place Unit 513
- 55 W Delaware Place Unit 608
- 33 W Delaware Place Unit 10B
- 33 W Delaware Place Unit 9D
- 33 W Delaware Place Unit 13A
- 33 W Delaware Place Unit 19H
- 9 W Walton St Unit 2802
- 1000 N State St Unit 14
- 1122 N Dearborn St Unit 18I
- 1122 N Dearborn St Unit P77
- 1030 N State St Unit 33GH
- 1030 N State St Unit 51J
- 1030 N State St Unit 38GH
- 1030 N State St Unit 21K
- 1030 N State St Unit 31K
- 930 N Clark St Unit J
- 930 N Clark St Unit L
- 930 N Clark St Unit E
- 930 N Clark St Unit 25C
- 930 N Clark St Unit 28D
- 930 N Clark St Unit K
- 930 N Clark St Unit I
- 930 N Clark St Unit F
- 930 N Clark St Unit B
- 930 N Clark St
- 930 N Clark St Unit C
- 123 W Oak St Unit E
- 123 W Oak St Unit 9B
- 123 W Oak St Unit 6B
- 123 W Oak St Unit 51B
- 123 W Oak St Unit 78
- 123 W Oak St Unit 1B
- 123 W Oak St Unit K
- 123 W Oak St Unit L
- 123 W Oak St Unit R