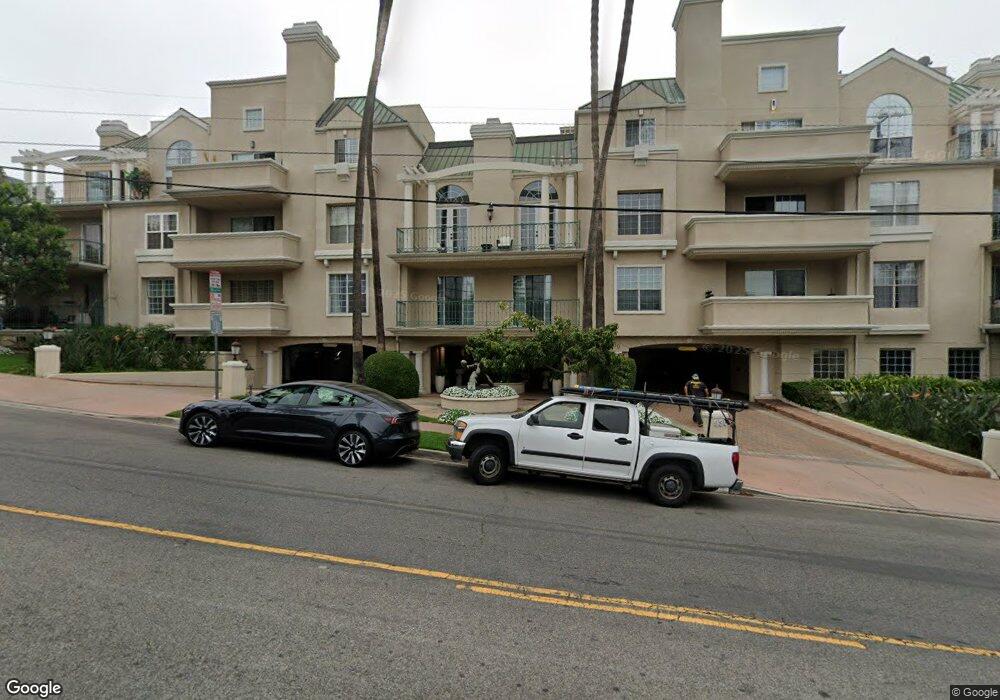
930 N Doheny Dr Unit 303 West Hollywood, CA 90069
Estimated Value: $1,105,000 - $1,246,000
2
Beds
3
Baths
1,487
Sq Ft
$800/Sq Ft
Est. Value
About This Home
This home is located at 930 N Doheny Dr Unit 303, West Hollywood, CA 90069 and is currently estimated at $1,189,868, approximately $800 per square foot. 930 N Doheny Dr Unit 303 is a home located in Los Angeles County with nearby schools including West Hollywood Elementary School, Hubert Howe Bancroft Middle School, and Fairfax High School.
Ownership History
Date
Name
Owned For
Owner Type
Purchase Details
Closed on
Jul 26, 2012
Sold by
Falcon Equity Lp
Bought by
Cal Equity Lp
Current Estimated Value
Purchase Details
Closed on
Jun 18, 2012
Sold by
Mitchell Eric A
Bought by
Falcon Equity Llp
Purchase Details
Closed on
Apr 26, 2007
Sold by
Mitchell William J
Bought by
Mitchell Eric A
Purchase Details
Closed on
Apr 13, 2004
Sold by
Mitchell Eric
Bought by
Mitchell Eric A
Purchase Details
Closed on
Apr 12, 2004
Sold by
Mitchell Eric A and Mitchell William J
Bought by
Mitchell Eric
Purchase Details
Closed on
May 6, 1996
Sold by
California Federal Bank
Bought by
Mitchell Eric A and Mitchell William J
Home Financials for this Owner
Home Financials are based on the most recent Mortgage that was taken out on this home.
Original Mortgage
$152,000
Interest Rate
7.68%
Create a Home Valuation Report for This Property
The Home Valuation Report is an in-depth analysis detailing your home's value as well as a comparison with similar homes in the area
Home Values in the Area
Average Home Value in this Area
Purchase History
| Date | Buyer | Sale Price | Title Company |
|---|---|---|---|
| Cal Equity Lp | -- | None Available | |
| Falcon Equity Llp | $419,500 | Fidelity Van Nuys | |
| Mitchell Eric A | -- | None Available | |
| Mitchell Eric A | -- | -- | |
| Mitchell Eric | -- | Ticor Title Company Of Ca | |
| Mitchell Eric A | $195,000 | Southland Title Corporation |
Source: Public Records
Mortgage History
| Date | Status | Borrower | Loan Amount |
|---|---|---|---|
| Previous Owner | Mitchell Eric A | $152,000 |
Source: Public Records
Tax History Compared to Growth
Tax History
| Year | Tax Paid | Tax Assessment Tax Assessment Total Assessment is a certain percentage of the fair market value that is determined by local assessors to be the total taxable value of land and additions on the property. | Land | Improvement |
|---|---|---|---|---|
| 2025 | $7,152 | $578,759 | $231,504 | $347,255 |
| 2024 | $7,152 | $567,412 | $226,965 | $340,447 |
| 2023 | $7,035 | $556,287 | $222,515 | $333,772 |
| 2022 | $6,685 | $545,380 | $218,152 | $327,228 |
| 2021 | $6,640 | $534,687 | $213,875 | $320,812 |
| 2019 | $6,425 | $518,830 | $207,532 | $311,298 |
| 2018 | $6,372 | $508,658 | $203,463 | $305,195 |
| 2016 | $6,100 | $488,908 | $195,563 | $293,345 |
| 2015 | $6,004 | $481,565 | $192,626 | $288,939 |
| 2014 | $6,005 | $472,133 | $188,853 | $283,280 |
Source: Public Records
Map
Nearby Homes
- 906 N Doheny Dr Unit 311
- 906 N Doheny Dr Unit 318
- 906 N Doheny Dr Unit 301
- 906 N Doheny Dr Unit 219
- 930 N Doheny Dr Unit 305
- 930 N Doheny Dr Unit 308
- 9005 Cynthia St Unit 209
- 960 N Doheny Dr Unit 306
- 959 N Doheny Dr Unit 205
- 713 N Doheny Dr
- 944 Hammond St
- 917 Hilldale Ave
- 919 Hilldale Ave
- 8960 Cynthia St Unit 109
- 929 Hilldale Ave
- 999 N Doheny Dr Unit 703
- 999 N Doheny Dr Unit 212
- 999 N Doheny Dr Unit 211
- 999 N Doheny Dr Unit 812
- 999 N Doheny Dr Unit 408
- 930 N Doheny Dr
- 930 N Doheny Dr
- 930 N Doheny Dr Unit 102
- 930 N Doheny Dr Unit 101
- 930 N Doheny Dr Unit 215
- 930 N Doheny Dr Unit 106
- 930 N Doheny Dr Unit 210
- 930 N Doheny Dr Unit 304
- 930 N Doheny Dr Unit 302
- 930 N Doheny Dr Unit 301
- 930 N Doheny Dr Unit 217
- 930 N Doheny Dr Unit 213
- 930 N Doheny Dr Unit 212
- 930 N Doheny Dr Unit 209
- 930 N Doheny Dr Unit 208
- 930 N Doheny Dr Unit 207
- 930 N Doheny Dr Unit 206
- 930 N Doheny Dr Unit 205
- 930 N Doheny Dr Unit 202
- 930 N Doheny Dr Unit 201