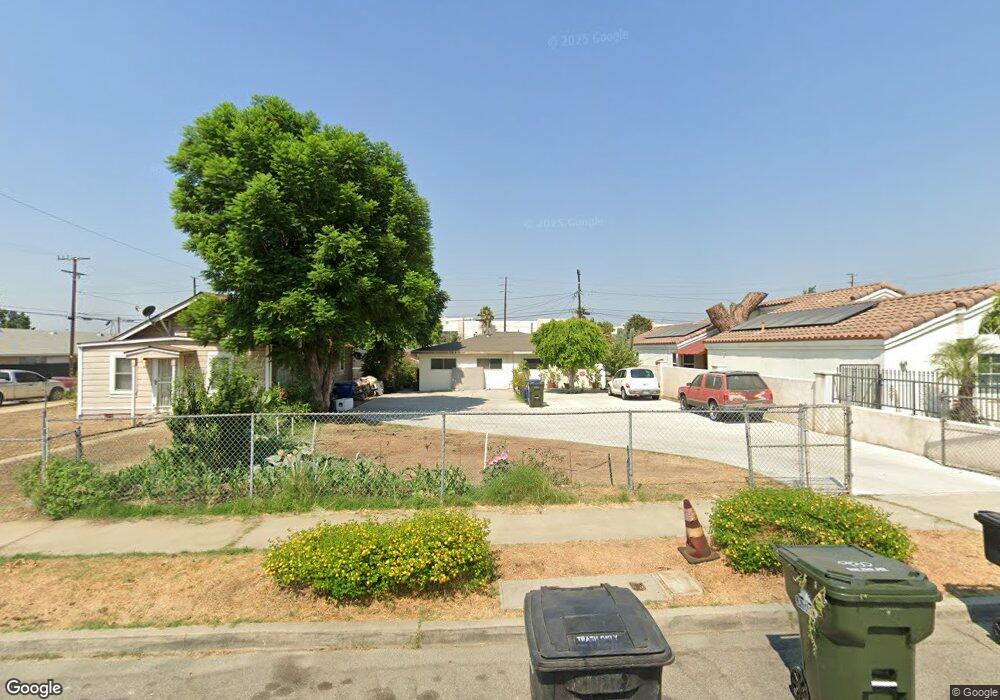
930 S Caldwell Ave Ontario, CA 91761
Downtown Ontario NeighborhoodEstimated Value: $693,440 - $788,000
4
Beds
2
Baths
1,400
Sq Ft
$531/Sq Ft
Est. Value
About This Home
This home is located at 930 S Caldwell Ave, Ontario, CA 91761 and is currently estimated at $742,860, approximately $530 per square foot. 930 S Caldwell Ave is a home located in San Bernardino County with nearby schools including Bon View Elementary, De Anza Middle, and Ontario High School.
Ownership History
Date
Name
Owned For
Owner Type
Purchase Details
Closed on
Mar 23, 2023
Sold by
Angulo Hector
Bought by
Martinez Yadira
Current Estimated Value
Purchase Details
Closed on
Oct 18, 2013
Sold by
Angulo Hector
Bought by
Angulo Hector and Martinez Yadira
Purchase Details
Closed on
Aug 16, 2004
Sold by
Angulo Hector
Bought by
Angulo Hector
Home Financials for this Owner
Home Financials are based on the most recent Mortgage that was taken out on this home.
Original Mortgage
$72,000
Interest Rate
5.95%
Mortgage Type
Stand Alone Refi Refinance Of Original Loan
Purchase Details
Closed on
Feb 26, 2002
Sold by
Angulo Alma Delia
Bought by
Angulo Hector
Home Financials for this Owner
Home Financials are based on the most recent Mortgage that was taken out on this home.
Original Mortgage
$68,512
Interest Rate
6.8%
Mortgage Type
FHA
Purchase Details
Closed on
Sep 8, 1993
Sold by
Hong Jong Pyo
Bought by
Angulo Vega Juan Gonzalez and Angulo Vega Beatriz
Create a Home Valuation Report for This Property
The Home Valuation Report is an in-depth analysis detailing your home's value as well as a comparison with similar homes in the area
Home Values in the Area
Average Home Value in this Area
Purchase History
| Date | Buyer | Sale Price | Title Company |
|---|---|---|---|
| Martinez Yadira | -- | -- | |
| Angulo Hector | -- | None Available | |
| Angulo Hector | -- | United Title Los Angeles | |
| Angulo Hector | -- | Commonwealth Land Title Co | |
| Angulo Hector | $90,000 | Commonwealth Land Title Co | |
| Angulo Vega Juan Gonzalez | -- | First American Title Insuran |
Source: Public Records
Mortgage History
| Date | Status | Borrower | Loan Amount |
|---|---|---|---|
| Previous Owner | Angulo Hector | $72,000 | |
| Previous Owner | Angulo Hector | $68,512 |
Source: Public Records
Tax History Compared to Growth
Tax History
| Year | Tax Paid | Tax Assessment Tax Assessment Total Assessment is a certain percentage of the fair market value that is determined by local assessors to be the total taxable value of land and additions on the property. | Land | Improvement |
|---|---|---|---|---|
| 2025 | $6,089 | $567,018 | $223,686 | $343,332 |
| 2024 | $6,089 | $555,900 | $219,300 | $336,600 |
| 2023 | $1,405 | $127,798 | $42,598 | $85,200 |
| 2022 | $1,386 | $125,292 | $41,763 | $83,529 |
| 2021 | $1,378 | $122,835 | $40,944 | $81,891 |
| 2020 | $1,354 | $121,575 | $40,524 | $81,051 |
| 2019 | $1,342 | $119,191 | $39,729 | $79,462 |
| 2018 | $1,324 | $116,854 | $38,950 | $77,904 |
| 2017 | $1,276 | $114,562 | $38,186 | $76,376 |
| 2016 | $1,227 | $112,315 | $37,437 | $74,878 |
| 2015 | $1,218 | $110,628 | $36,875 | $73,753 |
| 2014 | $1,180 | $219,038 | $63,537 | $155,501 |
Source: Public Records
Map
Nearby Homes
- 718 E Maitland St
- 736 E California St
- 740 E California St
- 902 S Hope Ave
- 932 S Bon View Ave
- 1107 S Greenwood Ave
- 1214 S Sultana Ave
- 1218 S Sultana Ave Unit A
- 1343 S Sultana Ave
- 548 E State St
- 428 S Sultana Ave
- 306 E Park St
- 830 E Emporia St
- 1512 S Pleasant Ave
- 918 E Holt Blvd
- 611 S Laurel Ave
- 127 N Campus Ave
- 132 N Monterey Ave
- 1650 S Campus Ave Unit 20
- 1420 S Euclid Ave Unit A & B
- 916 S Caldwell Ave
- 934 S Caldwell Ave
- 914 S Caldwell Ave
- 927 S Campus Ave
- 933 S Campus Ave
- 928 S Caldwell Ave
- 921 S Campus Ave
- 917 S Campus Ave
- 910 S Caldwell Ave
- 913 S Campus Ave Unit 2
- 913 S Campus Ave
- 908 S Caldwell Ave
- 927 S Caldwell Ave
- 923 S Caldwell Ave
- 933 S Caldwell Ave
- 907 S Campus Ave
- 0 E Maitland St
- 917 S Caldwell Ave
- 904 S Caldwell Ave
- 913 S Caldwell Ave