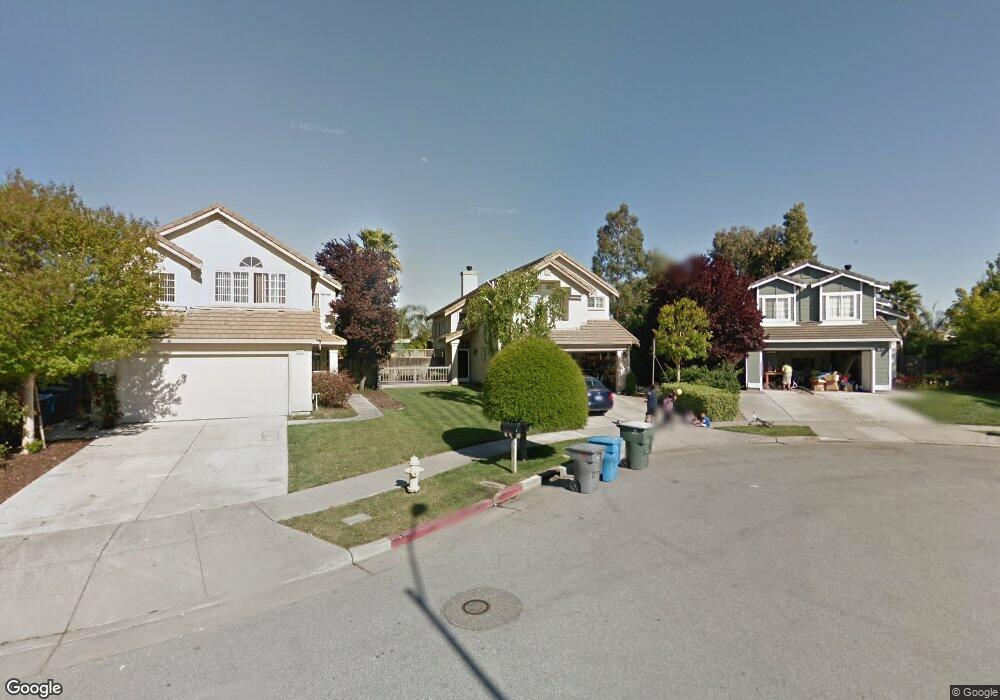
9300 Benbow Dr Gilroy, CA 95020
Las Animas NeighborhoodEstimated Value: $906,000 - $1,008,000
3
Beds
3
Baths
1,397
Sq Ft
$681/Sq Ft
Est. Value
About This Home
This home is located at 9300 Benbow Dr, Gilroy, CA 95020 and is currently estimated at $951,502, approximately $681 per square foot. 9300 Benbow Dr is a home located in Santa Clara County with nearby schools including Luigi Aprea Elementary School, Brownell Middle School, and Solorsano Middle School.
Ownership History
Date
Name
Owned For
Owner Type
Purchase Details
Closed on
Nov 10, 2019
Sold by
Oogjen Cory Cory and Oogjen Michelle
Bought by
Oogjen Cory William and Oogjen Michelle Kimberly
Current Estimated Value
Purchase Details
Closed on
Dec 3, 2002
Sold by
Kim Kyung Hee and Jang Jung Hee
Bought by
Oogjen Cory and Oogjen Michelle
Home Financials for this Owner
Home Financials are based on the most recent Mortgage that was taken out on this home.
Original Mortgage
$312,000
Interest Rate
5.75%
Purchase Details
Closed on
Jan 16, 2001
Sold by
Meyer Anthony S and Meyer Jacquelynne A
Bought by
Kim Kyung Hee and Jang Jung Hee
Home Financials for this Owner
Home Financials are based on the most recent Mortgage that was taken out on this home.
Original Mortgage
$287,000
Interest Rate
7.37%
Purchase Details
Closed on
Jan 2, 1997
Sold by
Maxxum Management Company
Bought by
Meyer Anthony S and Meyer Jacquelynne Amanda
Home Financials for this Owner
Home Financials are based on the most recent Mortgage that was taken out on this home.
Original Mortgage
$216,863
Interest Rate
7.16%
Create a Home Valuation Report for This Property
The Home Valuation Report is an in-depth analysis detailing your home's value as well as a comparison with similar homes in the area
Home Values in the Area
Average Home Value in this Area
Purchase History
| Date | Buyer | Sale Price | Title Company |
|---|---|---|---|
| Oogjen Cory William | -- | None Available | |
| Oogjen Cory | $390,000 | Chicago Title | |
| Kim Kyung Hee | $410,000 | Old Republic Title Company | |
| Meyer Anthony S | $228,500 | Golden California Title Co |
Source: Public Records
Mortgage History
| Date | Status | Borrower | Loan Amount |
|---|---|---|---|
| Previous Owner | Oogjen Cory | $312,000 | |
| Previous Owner | Kim Kyung Hee | $287,000 | |
| Previous Owner | Meyer Anthony S | $216,863 | |
| Closed | Oogjen Cory | $78,000 |
Source: Public Records
Tax History
| Year | Tax Paid | Tax Assessment Tax Assessment Total Assessment is a certain percentage of the fair market value that is determined by local assessors to be the total taxable value of land and additions on the property. | Land | Improvement |
|---|---|---|---|---|
| 2025 | $7,122 | $589,346 | $246,204 | $343,142 |
| 2024 | $7,122 | $577,791 | $241,377 | $336,414 |
| 2023 | $7,079 | $566,463 | $236,645 | $329,818 |
| 2022 | $6,961 | $555,356 | $232,005 | $323,351 |
| 2021 | $6,929 | $544,467 | $227,456 | $317,011 |
| 2020 | $6,852 | $538,885 | $225,124 | $313,761 |
| 2019 | $6,787 | $528,319 | $220,710 | $307,609 |
| 2018 | $6,336 | $517,961 | $216,383 | $301,578 |
| 2017 | $6,468 | $507,806 | $212,141 | $295,665 |
| 2016 | $6,336 | $497,850 | $207,982 | $289,868 |
| 2015 | $5,977 | $490,372 | $204,858 | $285,514 |
| 2014 | $5,698 | $461,300 | $192,700 | $268,600 |
Source: Public Records
Map
Nearby Homes
- 9400 Benbow Dr
- 946 Martiri Ct
- 1165 Lerma Ln
- 803 Sunrise Dr
- 1080 Sunrise Dr
- 1320 Heritage Way
- 735 Painter Ct
- 1206 Sycamore Ct
- 1404 Casablanca Cir
- 9465 Eagle View Way
- 1437 Briarberry Ln
- 9130 Rancho Hills Dr
- 1501 Welburn Ave
- 119 Farrell Ave
- 103 Farrell Ave
- 111 Farrell Ave
- 8980 Acorn Way
- 8940 Acorn Way
- 170 Sturla Way
- 1008 Primrose Ln
- 9310 Benbow Dr
- 980 Sage Hill Dr
- 9320 Benbow Dr
- 990 Sage Hill Dr
- 9330 Benbow Dr
- 1010 Sage Hill Dr
- 995 Sage Hill Dr
- 9340 Benbow Dr
- 975 Summerhill Cir
- 1020 Sage Hill Dr
- 955 Summerhill Cir
- 985 Summerhill Cir
- 1005 Sage Hill Dr
- 9350 Benbow Dr
- 935 Summerhill Cir
- 9333 Benbow Dr
- 1040 Sage Hill Dr
- 1025 Sage Hill Dr
- 991 Woodcreek Way
- 9343 Benbow Dr
Your Personal Tour Guide
Ask me questions while you tour the home.