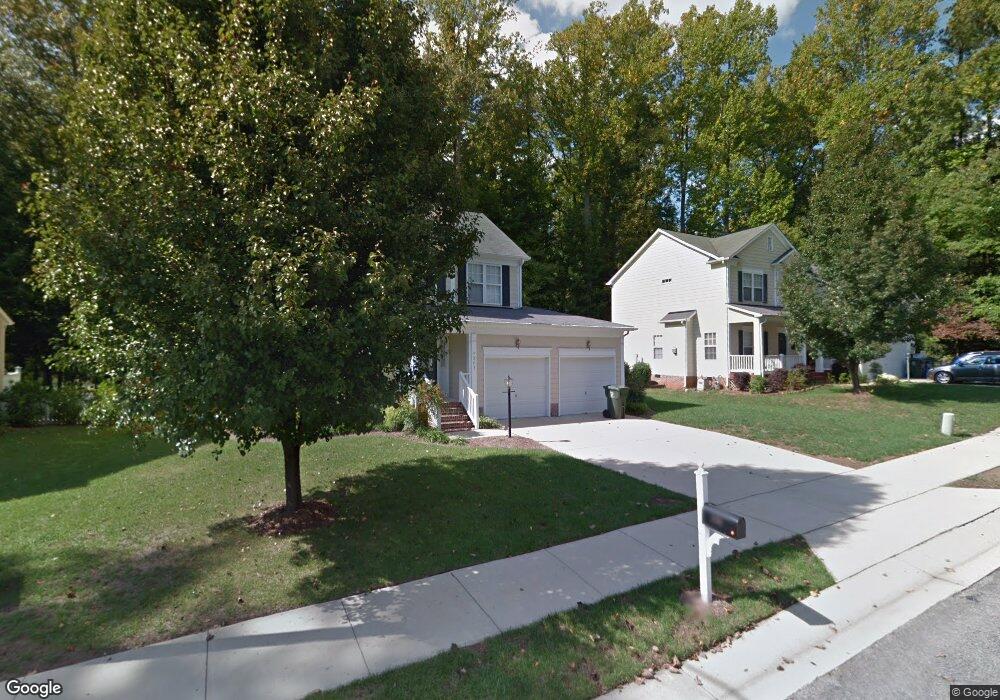
9301 Shallcross Way Raleigh, NC 27617
Umstead NeighborhoodEstimated Value: $431,000 - $446,000
3
Beds
3
Baths
1,450
Sq Ft
$304/Sq Ft
Est. Value
About This Home
This home is located at 9301 Shallcross Way, Raleigh, NC 27617 and is currently estimated at $440,275, approximately $303 per square foot. 9301 Shallcross Way is a home located in Wake County with nearby schools including Leesville Road Elementary School, Leesville Road Middle School, and Leesville Road High School.
Ownership History
Date
Name
Owned For
Owner Type
Purchase Details
Closed on
Nov 29, 2010
Sold by
Stockett Denise E and Stockett John Lewis
Bought by
Lambert Jacob Brent
Current Estimated Value
Home Financials for this Owner
Home Financials are based on the most recent Mortgage that was taken out on this home.
Original Mortgage
$192,060
Outstanding Balance
$126,761
Interest Rate
4.2%
Mortgage Type
New Conventional
Estimated Equity
$313,514
Purchase Details
Closed on
Aug 27, 1999
Sold by
Beazer Homes Corp
Bought by
Kauk Denise E
Home Financials for this Owner
Home Financials are based on the most recent Mortgage that was taken out on this home.
Original Mortgage
$147,550
Interest Rate
7.58%
Create a Home Valuation Report for This Property
The Home Valuation Report is an in-depth analysis detailing your home's value as well as a comparison with similar homes in the area
Home Values in the Area
Average Home Value in this Area
Purchase History
| Date | Buyer | Sale Price | Title Company |
|---|---|---|---|
| Lambert Jacob Brent | $198,000 | None Available | |
| Kauk Denise E | $155,500 | -- |
Source: Public Records
Mortgage History
| Date | Status | Borrower | Loan Amount |
|---|---|---|---|
| Open | Lambert Jacob Brent | $192,060 | |
| Previous Owner | Kauk Denise E | $147,550 |
Source: Public Records
Tax History Compared to Growth
Tax History
| Year | Tax Paid | Tax Assessment Tax Assessment Total Assessment is a certain percentage of the fair market value that is determined by local assessors to be the total taxable value of land and additions on the property. | Land | Improvement |
|---|---|---|---|---|
| 2025 | $4,081 | $465,646 | $170,000 | $295,646 |
| 2024 | $4,064 | $465,646 | $170,000 | $295,646 |
| 2023 | $2,915 | $265,626 | $80,000 | $185,626 |
| 2022 | $2,709 | $265,626 | $80,000 | $185,626 |
| 2021 | $2,605 | $265,626 | $80,000 | $185,626 |
| 2020 | $2,557 | $265,626 | $80,000 | $185,626 |
| 2019 | $2,496 | $213,681 | $70,000 | $143,681 |
| 2018 | $2,355 | $213,681 | $70,000 | $143,681 |
| 2017 | $2,243 | $213,681 | $70,000 | $143,681 |
| 2016 | $2,197 | $213,681 | $70,000 | $143,681 |
| 2015 | $2,189 | $209,452 | $66,000 | $143,452 |
| 2014 | $2,076 | $209,452 | $66,000 | $143,452 |
Source: Public Records
Map
Nearby Homes
- 9337 Langwood Dr
- 9209 Shallcross Way
- 9800 Treymore Dr
- 9305 Langwood Dr
- 9023 Colony Village Ln
- 6123 Blakeman Ln
- 13204 Ashford Park Dr
- 13217 Ashford Park Dr
- 9413 Bells Valley Dr
- 9305 Dominion Blvd
- 7942 Berry Crest Ave
- 7846 Cape Charles Dr
- 10900 Bayflower Way
- 10901 Bayflower Way
- 10907 Bayflower Way
- 10906 Bayflower Way
- 10916 Bayflower Way
- 10917 Bayflower Way
- 8939 Camden Park Dr
- 6108 Dunzo Dr
- 9249 Shallcross Way
- 9249 Shallcross Way Unit (UnitID 12647712)
- 9305 Shallcross Way
- 9247 Shallcross Way
- 9300 Shallcross Way
- 9304 Shallcross Way
- 9349 Langwood Dr
- 5418 Windy Gap Ct
- 9245 Shallcross Way
- 9345 Langwood Dr
- 9344 Langwood Dr
- 9341 Langwood Dr
- 9241 Shallcross Way
- 9340 Langwood Dr
- 9232 Shallcross Way
- 9237 Shallcross Way
- 9336 Langwood Dr
- 9112 Willow Valley Ct
- 9228 Shallcross Way
- 9233 Shallcross Way