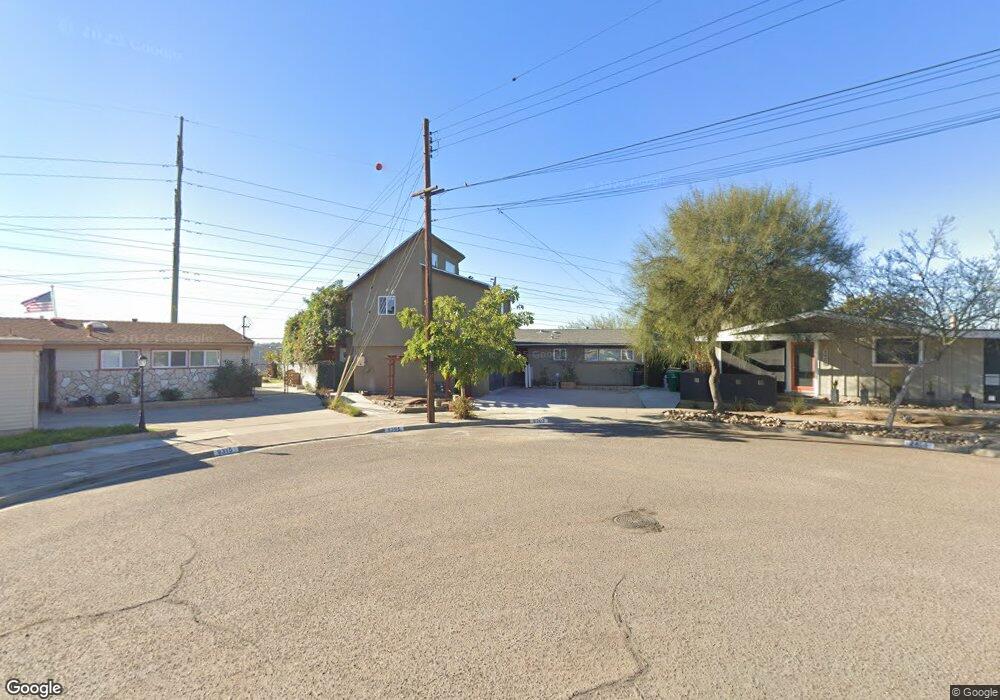
9303 Broadview Ave San Diego, CA 92123
Serra Mesa NeighborhoodEstimated Value: $977,000 - $1,138,699
3
Beds
2
Baths
1,256
Sq Ft
$824/Sq Ft
Est. Value
About This Home
This home is located at 9303 Broadview Ave, San Diego, CA 92123 and is currently estimated at $1,035,425, approximately $824 per square foot. 9303 Broadview Ave is a home located in San Diego County with nearby schools including Juarez Elementary School, Taft Middle School, and St. Columba Catholic School.
Ownership History
Date
Name
Owned For
Owner Type
Purchase Details
Closed on
Jul 16, 2018
Sold by
Phamhw Mon Quang and Nguyen Ha Kim
Bought by
Phamhw Mon Quang and Nguyen Ha Kim
Current Estimated Value
Purchase Details
Closed on
Jan 4, 2016
Sold by
Klb Property Llc
Bought by
Nguyen Ha Kim and Pham Mon Quang
Home Financials for this Owner
Home Financials are based on the most recent Mortgage that was taken out on this home.
Original Mortgage
$180,000
Outstanding Balance
$142,970
Interest Rate
3.92%
Mortgage Type
Seller Take Back
Estimated Equity
$892,455
Purchase Details
Closed on
Jul 28, 2010
Sold by
Tran Derrick Dang Hai
Bought by
Klb Properties Llc
Purchase Details
Closed on
Dec 6, 2006
Sold by
Taber Dale H
Bought by
Tran Derrick Dang Hai
Home Financials for this Owner
Home Financials are based on the most recent Mortgage that was taken out on this home.
Original Mortgage
$45,000
Interest Rate
5.88%
Mortgage Type
Unknown
Create a Home Valuation Report for This Property
The Home Valuation Report is an in-depth analysis detailing your home's value as well as a comparison with similar homes in the area
Home Values in the Area
Average Home Value in this Area
Purchase History
| Date | Buyer | Sale Price | Title Company |
|---|---|---|---|
| Phamhw Mon Quang | -- | None Available | |
| Nguyen Ha Kim | $360,000 | Fidelity National Title Co | |
| Klb Properties Llc | $337,000 | Chicago Title Company | |
| Tran Derrick Dang Hai | $450,000 | New Century Title Company |
Source: Public Records
Mortgage History
| Date | Status | Borrower | Loan Amount |
|---|---|---|---|
| Open | Nguyen Ha Kim | $180,000 | |
| Previous Owner | Tran Derrick Dang Hai | $45,000 | |
| Previous Owner | Tran Derrick Dang Hai | $360,000 |
Source: Public Records
Tax History Compared to Growth
Tax History
| Year | Tax Paid | Tax Assessment Tax Assessment Total Assessment is a certain percentage of the fair market value that is determined by local assessors to be the total taxable value of land and additions on the property. | Land | Improvement |
|---|---|---|---|---|
| 2025 | $7,503 | $627,406 | $414,325 | $213,081 |
| 2024 | $7,503 | $615,104 | $406,201 | $208,903 |
| 2023 | $7,336 | $603,044 | $398,237 | $204,807 |
| 2022 | $7,139 | $591,221 | $390,429 | $200,792 |
| 2021 | $7,089 | $579,629 | $382,774 | $196,855 |
| 2020 | $7,002 | $573,687 | $378,850 | $194,837 |
| 2019 | $6,876 | $562,439 | $371,422 | $191,017 |
| 2018 | $6,427 | $551,412 | $364,140 | $187,272 |
| 2017 | $6,273 | $540,600 | $357,000 | $183,600 |
| 2016 | $4,789 | $405,328 | $243,146 | $162,182 |
| 2015 | $4,249 | $359,240 | $239,494 | $119,746 |
| 2014 | $4,183 | $352,204 | $234,803 | $117,401 |
Source: Public Records
Map
Nearby Homes
- 9212 Ronda Ave
- 2597 Melbourne Dr
- 2546 Marathon Dr
- 9452 Larrabee Ave
- 2756 Bellezza Dr
- 2642 Bellezza Dr
- 2610 Bellezza Dr Unit 19
- 2765 Bellezza Dr
- 2753 Bellezza Dr
- 2770 Piantino Cir Unit 47
- 2772 Piantino Cir Unit 45
- 2806 Mission Village Dr
- 9208 Piantino Way Unit 127
- 2673 Larkin Place
- 2902 Amulet St
- 2816 Villas Way
- 2932 Villas Way
- 9261 Fullerton Ave
- 2756 W Canyon Ave Unit 61
- 2517 Escala Cir
- 2408 Monette Dr
- 9315 Broadview Ave
- 2424 Monette Dr
- 9327 Broadview Ave
- 2440 Monette Dr
- 9339 Broadview Ave
- 2423 Monette Dr
- 2456 Monette Dr
- 2439 Monette Dr
- 9351 Broadview Ave
- 2420 Moonstone Dr
- 0 Monette Dr 2455
- 2455 Monette Dr
- 2472 Monette Dr
- 9363 Broadview Ave
- 2471 Monette Dr
- 2448 Moonstone Dr
- 2488 Monette Dr
- 9371 Broadview Ave
- 2466 Moonstone Dr Unit 15