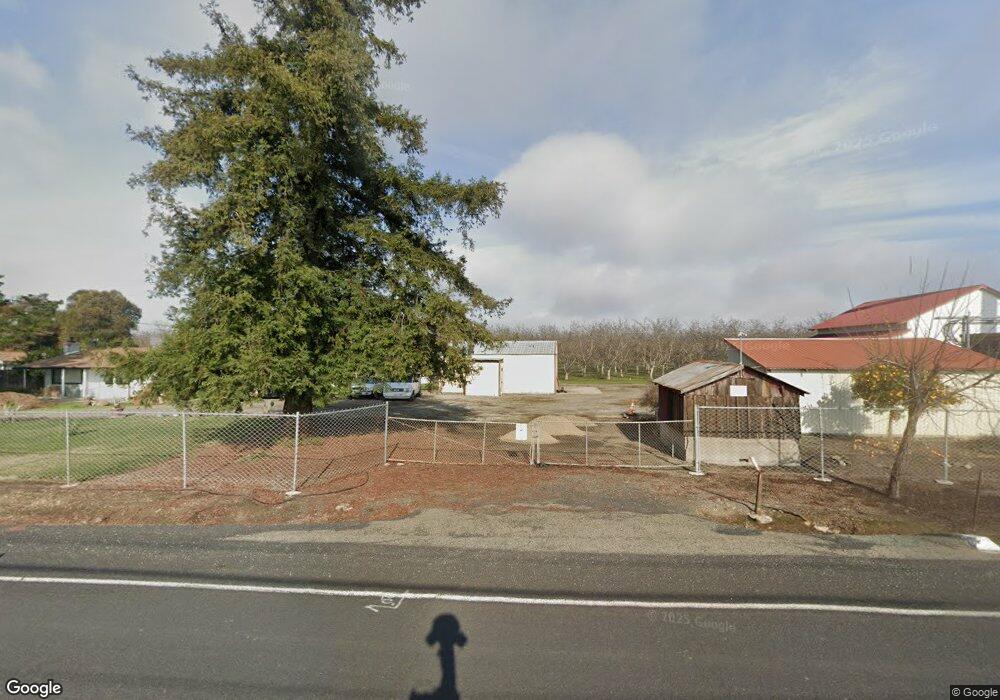
9303 Live Oak Rd Stockton, CA 95212
Estimated Value: $654,000 - $1,291,880
2
Beds
1
Bath
960
Sq Ft
$929/Sq Ft
Est. Value
About This Home
This home is located at 9303 Live Oak Rd, Stockton, CA 95212 and is currently estimated at $891,627, approximately $928 per square foot. 9303 Live Oak Rd is a home located in San Joaquin County with nearby schools including Live Oak Elementary School, Morada Middle School, and Tokay High School.
Ownership History
Date
Name
Owned For
Owner Type
Purchase Details
Closed on
Jun 19, 2022
Sold by
Valinoti Jan M
Bought by
Live Oak Road Prop Llc
Current Estimated Value
Purchase Details
Closed on
Jun 15, 2022
Sold by
Valinoti Kenneth L
Bought by
Live Oak Road Properties Llc
Purchase Details
Closed on
Feb 18, 2021
Sold by
Valinoti Jan M
Bought by
Valinoti Galloway R and Valinoti Jan M
Purchase Details
Closed on
Jan 20, 2021
Sold by
Valinoti Sharon L and The Valinoti 2000 Family Trust
Bought by
Valinoti Jan M and Valinoti Kenneth L
Purchase Details
Closed on
Dec 23, 2011
Sold by
Valinoti Barbara
Bought by
Valinoti Daniel Dean
Purchase Details
Closed on
Nov 28, 2011
Sold by
Valinoti Daniel Dean
Bought by
Valinoti Ronald L and Valinoti Sharon L
Purchase Details
Closed on
Jun 15, 2000
Sold by
Valinoti Ronald L and Valinoti Sharon L
Bought by
Valinoti Ronald L and Valinoti Sharon L
Create a Home Valuation Report for This Property
The Home Valuation Report is an in-depth analysis detailing your home's value as well as a comparison with similar homes in the area
Home Values in the Area
Average Home Value in this Area
Purchase History
| Date | Buyer | Sale Price | Title Company |
|---|---|---|---|
| Live Oak Road Prop Llc | -- | None Listed On Document | |
| Valinoti Jan M | -- | None Listed On Document | |
| Live Oak Road Properties Llc | -- | None Listed On Document | |
| Valinoti Kenneth L | -- | None Listed On Document | |
| Valinoti Galloway R | -- | None Available | |
| Valinoti Jan M | -- | None Available | |
| Valinoti Daniel Dean | -- | None Available | |
| Valinoti Ronald L | $234,000 | None Available | |
| Valinoti Ronald L | -- | -- | |
| Valinoti Ronald L | -- | -- |
Source: Public Records
Tax History Compared to Growth
Tax History
| Year | Tax Paid | Tax Assessment Tax Assessment Total Assessment is a certain percentage of the fair market value that is determined by local assessors to be the total taxable value of land and additions on the property. | Land | Improvement |
|---|---|---|---|---|
| 2025 | $7,499 | $463,418 | $355,133 | $108,285 |
| 2024 | $9,534 | $657,404 | $523,033 | $134,371 |
| 2023 | $7,082 | $474,749 | $370,668 | $104,081 |
| 2022 | $6,843 | $454,216 | $352,175 | $102,041 |
| 2021 | $5,276 | $440,650 | $340,609 | $100,041 |
| 2020 | $4,837 | $408,551 | $309,535 | $99,016 |
| 2019 | $4,605 | $387,760 | $290,685 | $97,075 |
| 2018 | $4,327 | $360,807 | $265,085 | $95,722 |
| 2017 | $4,005 | $333,012 | $239,706 | $93,306 |
| 2016 | $3,581 | $292,885 | $201,408 | $91,477 |
| 2014 | $5,666 | $503,460 | $155,062 | $348,398 |
Source: Public Records
Map
Nearby Homes
- 11850 Live Oak Rd
- 11791 N Alpine Rd
- 8400 E Handel Rd
- 11881 N Alpine Rd
- 14700 N Locust Tree Rd
- 12750 E Live Oak Rd
- 13299 N Curry Ave
- 17036 N Locust Tree Rd
- 18450 N Highway 88 Unit 60
- 13495 E Live Oak Rd
- 15296 N Highway 88
- 15396 N Highway 88
- 5425 El Greco Dr
- 15889 N Tecklenburg Rd
- 11303 N Highway 99 Unit 8
- 10374 Black Oak Ct
- 10780 N Highway 99
- 16795 N Manor Ln
- 12555 E Comstock Rd
- 17010 N Locust Tree Rd
- 9535 Live Oak Rd
- 9255 Live Oak Rd
- 9215 Live Oak Rd
- 9617 Live Oak Rd
- 9675 Live Oak Rd
- 8958 Live Oak Rd
- 9663 Live Oak Rd
- 9101 Live Oak Rd
- 9390 E Handel Rd
- 8874 Live Oak Rd
- 8989 Live Oak Rd
- 9776 Live Oak Rd
- 8975 Live Oak Rd
- 8937 Live Oak Rd
- 8746 Live Oak Rd
- 8855 Live Oak Rd
- 8600 Live Oak Rd
- 8771 Live Oak Rd
- 8674 Live Oak Rd
- 12042 N Alpine Rd