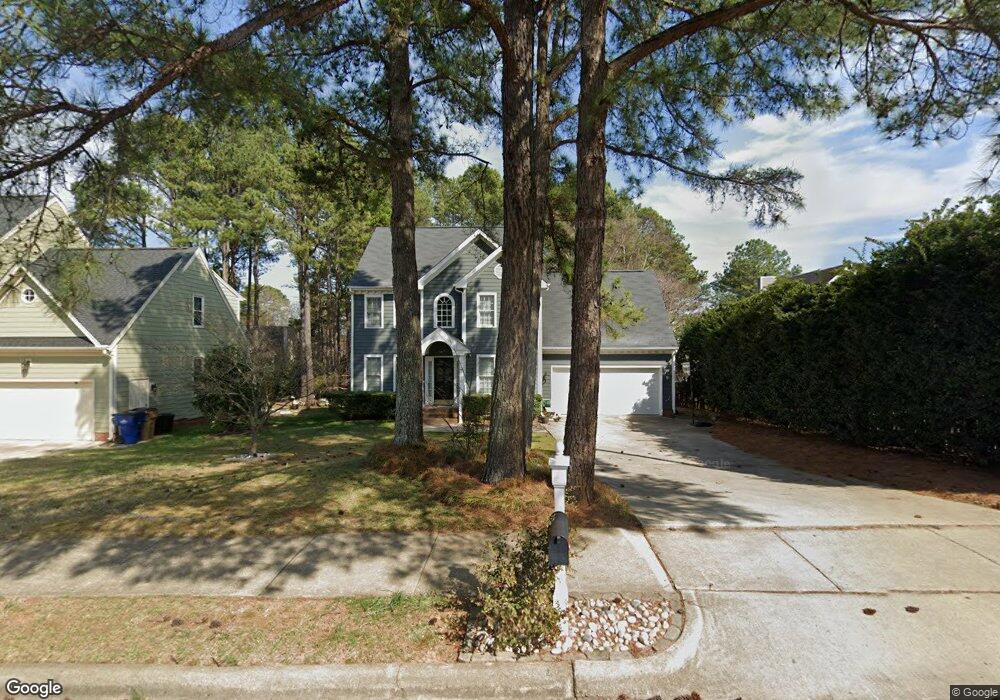
9304 Cub Trail Raleigh, NC 27615
Durant NeighborhoodEstimated Value: $466,427 - $496,000
3
Beds
3
Baths
1,908
Sq Ft
$255/Sq Ft
Est. Value
About This Home
This home is located at 9304 Cub Trail, Raleigh, NC 27615 and is currently estimated at $487,107, approximately $255 per square foot. 9304 Cub Trail is a home located in Wake County with nearby schools including Durant Road Elementary, Durant Road Middle, and Millbrook High School.
Ownership History
Date
Name
Owned For
Owner Type
Purchase Details
Closed on
Aug 26, 2011
Sold by
Gordon Jeffrey and Gordon Tina
Bought by
Feldman Lauren R and Taylor Grayson D
Current Estimated Value
Home Financials for this Owner
Home Financials are based on the most recent Mortgage that was taken out on this home.
Original Mortgage
$223,194
Outstanding Balance
$154,583
Interest Rate
4.5%
Mortgage Type
FHA
Estimated Equity
$332,524
Purchase Details
Closed on
Jan 27, 2006
Sold by
Newell Eric N and Newell Natalie
Bought by
Gordon Jeffrey and Gordon Tina
Home Financials for this Owner
Home Financials are based on the most recent Mortgage that was taken out on this home.
Original Mortgage
$181,200
Interest Rate
6.21%
Mortgage Type
Fannie Mae Freddie Mac
Purchase Details
Closed on
Jun 20, 2002
Sold by
Tasket Ronald W and Tasket Paticia J
Bought by
Newell Eric N and Hughes Natalie M
Home Financials for this Owner
Home Financials are based on the most recent Mortgage that was taken out on this home.
Original Mortgage
$157,600
Interest Rate
6.75%
Create a Home Valuation Report for This Property
The Home Valuation Report is an in-depth analysis detailing your home's value as well as a comparison with similar homes in the area
Home Values in the Area
Average Home Value in this Area
Purchase History
| Date | Buyer | Sale Price | Title Company |
|---|---|---|---|
| Feldman Lauren R | $229,000 | None Available | |
| Gordon Jeffrey | $227,000 | None Available | |
| Newell Eric N | $197,000 | -- |
Source: Public Records
Mortgage History
| Date | Status | Borrower | Loan Amount |
|---|---|---|---|
| Open | Feldman Lauren R | $223,194 | |
| Previous Owner | Gordon Jeffrey | $181,200 | |
| Previous Owner | Gordon Jeffrey | $33,975 | |
| Previous Owner | Newell Eric N | $157,600 | |
| Closed | Newell Eric N | $29,500 |
Source: Public Records
Tax History Compared to Growth
Tax History
| Year | Tax Paid | Tax Assessment Tax Assessment Total Assessment is a certain percentage of the fair market value that is determined by local assessors to be the total taxable value of land and additions on the property. | Land | Improvement |
|---|---|---|---|---|
| 2025 | $3,515 | $400,751 | $100,000 | $300,751 |
| 2024 | $3,501 | $400,751 | $100,000 | $300,751 |
| 2023 | $3,364 | $306,817 | $80,000 | $226,817 |
| 2022 | $3,127 | $306,817 | $80,000 | $226,817 |
| 2021 | $3,005 | $306,817 | $80,000 | $226,817 |
| 2020 | $2,951 | $306,817 | $80,000 | $226,817 |
| 2019 | $2,838 | $243,204 | $73,000 | $170,204 |
| 2018 | $2,677 | $243,204 | $73,000 | $170,204 |
| 2017 | $2,550 | $243,204 | $73,000 | $170,204 |
| 2016 | $2,498 | $243,204 | $73,000 | $170,204 |
| 2015 | $2,486 | $238,147 | $68,000 | $170,147 |
| 2014 | -- | $238,147 | $68,000 | $170,147 |
Source: Public Records
Map
Nearby Homes
- 9100 Deershire Ct
- 9505 Crestland Woods Dr
- 9512 Anson Grove Ln
- 2324 Dahlgreen Rd
- 2408 Deanwood Dr
- 8700 Den Ct
- 11001 Louson Place
- 11020 Southwalk Ln
- 9101 Jackknife Trail
- 11035 Southwalk Ln
- 9012 Walking Stick Trail
- 3212 Loyal Ln
- 9013 Tenderfoot Trail
- 8600 Clivedon Dr
- 8913 Walking Stick Trail
- 8909 Creekstone Ct Unit 11
- 2505 Coxindale Dr
- 9509 Greenfield Dr
- 1301 Durlain Dr Unit 103
- 8804 Colesbury Dr
- 9308 Cub Trail
- 9228 Dawnshire Rd
- 9232 Dawnshire Rd
- 9224 Dawnshire Rd
- 2925 Dahlgreen Rd
- 2917 Dahlgreen Rd
- 2933 Dahlgreen Rd
- 2913 Dahlgreen Rd
- 9300 Dawnshire Rd
- 2909 Dahlgreen Rd
- 9305 Cub Trail
- 9309 Cub Trail
- 9220 Dawnshire Rd
- 9216 Cub Trail
- 2905 Dahlgreen Rd
- 9217 Dawnshire Rd
- 9313 Cub Trail
- 9304 Dawnshire Rd
- 9406 Cub Trail
- 9212 Cub Trail