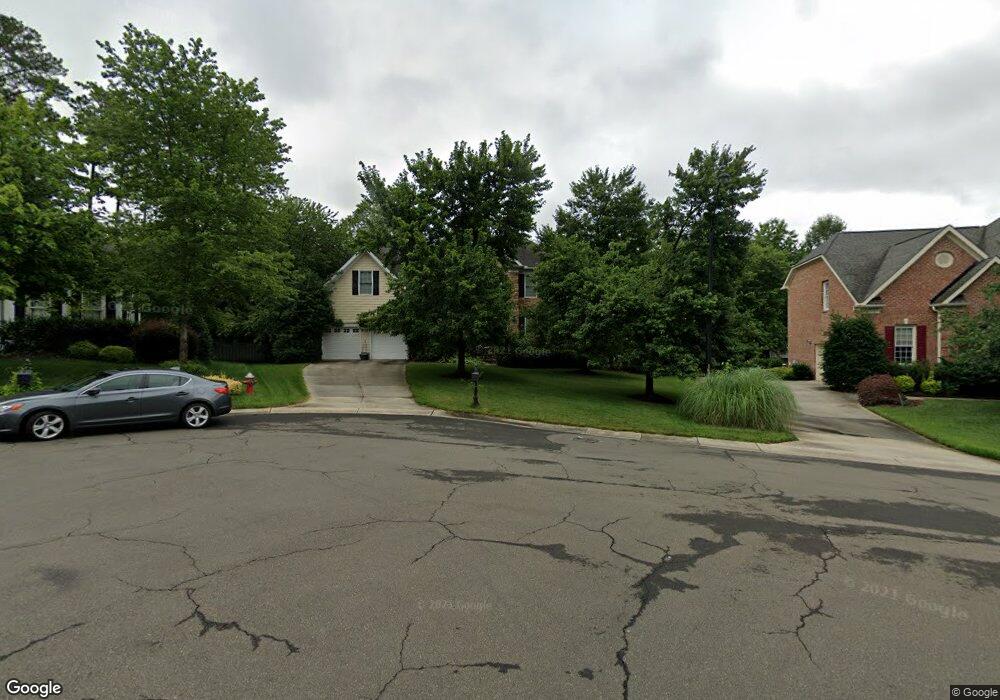
9305 Teton Pines Way Raleigh, NC 27617
Brier Creek NeighborhoodEstimated Value: $943,000 - $1,033,000
5
Beds
4
Baths
3,691
Sq Ft
$267/Sq Ft
Est. Value
About This Home
This home is located at 9305 Teton Pines Way, Raleigh, NC 27617 and is currently estimated at $984,326, approximately $266 per square foot. 9305 Teton Pines Way is a home located in Wake County with nearby schools including Brier Creek Elementary School, Pine Hollow Middle School, and Leesville Road High School.
Ownership History
Date
Name
Owned For
Owner Type
Purchase Details
Closed on
Jan 19, 2021
Sold by
Wire John A
Bought by
Chang Tin Yuan and Jiang Hui Hong
Current Estimated Value
Home Financials for this Owner
Home Financials are based on the most recent Mortgage that was taken out on this home.
Original Mortgage
$495,000
Outstanding Balance
$441,789
Interest Rate
2.71%
Mortgage Type
New Conventional
Estimated Equity
$542,537
Purchase Details
Closed on
Jul 1, 2013
Sold by
Wire Mary G
Bought by
Wire John A
Home Financials for this Owner
Home Financials are based on the most recent Mortgage that was taken out on this home.
Original Mortgage
$240,000
Interest Rate
3.96%
Mortgage Type
New Conventional
Purchase Details
Closed on
Oct 21, 2002
Sold by
Toll At Brier Creek Ltd Partnership
Bought by
Wire John A and Wire Mary G
Home Financials for this Owner
Home Financials are based on the most recent Mortgage that was taken out on this home.
Original Mortgage
$270,000
Interest Rate
6.18%
Create a Home Valuation Report for This Property
The Home Valuation Report is an in-depth analysis detailing your home's value as well as a comparison with similar homes in the area
Home Values in the Area
Average Home Value in this Area
Purchase History
| Date | Buyer | Sale Price | Title Company |
|---|---|---|---|
| Chang Tin Yuan | $660,000 | None Available | |
| Wire John A | -- | None Available | |
| Wire John A | $421,000 | -- |
Source: Public Records
Mortgage History
| Date | Status | Borrower | Loan Amount |
|---|---|---|---|
| Open | Chang Tin Yuan | $495,000 | |
| Previous Owner | Wire John A | $240,000 | |
| Previous Owner | Wire John A | $270,000 |
Source: Public Records
Tax History Compared to Growth
Tax History
| Year | Tax Paid | Tax Assessment Tax Assessment Total Assessment is a certain percentage of the fair market value that is determined by local assessors to be the total taxable value of land and additions on the property. | Land | Improvement |
|---|---|---|---|---|
| 2025 | $7,434 | $850,083 | $180,000 | $670,083 |
| 2024 | $7,403 | $850,083 | $180,000 | $670,083 |
| 2023 | $6,264 | $572,852 | $115,000 | $457,852 |
| 2022 | $5,820 | $572,852 | $115,000 | $457,852 |
| 2021 | $5,594 | $572,852 | $115,000 | $457,852 |
| 2020 | $5,492 | $572,852 | $115,000 | $457,852 |
| 2019 | $6,116 | $525,989 | $125,000 | $400,989 |
| 2018 | $5,767 | $525,989 | $125,000 | $400,989 |
| 2017 | $5,492 | $525,989 | $125,000 | $400,989 |
| 2016 | $5,379 | $525,989 | $125,000 | $400,989 |
| 2015 | $5,993 | $576,857 | $146,000 | $430,857 |
| 2014 | $5,684 | $576,857 | $146,000 | $430,857 |
Source: Public Records
Map
Nearby Homes
- 10713 Round Brook Cir
- 10733 Round Brook Cir
- 9220 Meadow Mist Ct
- 9324 Royal Crest Dr
- 9112 Mission Hills Ct
- 9128 Palm Bay Cir
- 9136 Meadow Mist Ct
- 9210 White Eagle Ct
- 9208 Palm Bay Cir
- 9109 Club Hill Dr
- 11013 Maplecroft Ct
- 8937 Winged Thistle Ct
- 11124 Penderwood Ct
- 9412 Harvest Acres Ct
- 9410 Harvest Acres Ct
- 11213 Presidio Dr
- 1130 Bacchanal Ln
- 1130 Bacchanal Ln Unit 19
- 2530 Friedland Place Unit 104
- 11637 Broadfield Ct
- 9309 Teton Pines Way
- 9301 Teton Pines Way
- 10700 Round Brook Cir
- 10704 Round Brook Cir
- 9313 Teton Pines Way
- 10100 Sporting Club Dr
- 9300 Teton Pines Way
- 10708 Round Brook Cir
- 9304 Teton Pines Way
- 9308 Teton Pines Way
- 10104 Sporting Club Dr
- 10101 Sporting Club Dr
- 9317 Teton Pines Way
- 10712 Round Brook Cir
- 9316 Teton Pines Way
- 10701 Round Brook Cir
- 9301 Naples Ct
- 10105 Sporting Club Dr
- 9305 Naples Ct
- 10705 Round Brook Cir