930N Turtle Cove Unit 155 Irving, TX 75060
South Irving NeighborhoodEstimated Value: $166,000 - $196,000
2
Beds
2
Baths
1,205
Sq Ft
$151/Sq Ft
Est. Value
About This Home
This home is located at 930N Turtle Cove Unit 155, Irving, TX 75060 and is currently estimated at $181,444, approximately $150 per square foot. 930N Turtle Cove Unit 155 is a home located in Dallas County with nearby schools including Townley Elementary School, Bowie Middle School, and Nimitz High School.
Ownership History
Date
Name
Owned For
Owner Type
Purchase Details
Closed on
Dec 11, 2024
Sold by
Nunez-Ramirez Leticia and Ramirez Carlos
Bought by
Springlake Home Solutions Llc
Current Estimated Value
Home Financials for this Owner
Home Financials are based on the most recent Mortgage that was taken out on this home.
Original Mortgage
$140,000
Outstanding Balance
$113,515
Interest Rate
6.72%
Mortgage Type
Seller Take Back
Estimated Equity
$67,929
Purchase Details
Closed on
May 23, 2023
Sold by
Nunez Ana L and Lindsay Irene
Bought by
Nunez-Ramirez Leticia
Purchase Details
Closed on
Jan 26, 1996
Sold by
Turtle Lakcan Development Inc
Bought by
Yousuf Mohammad M and Yousuf Farian A
Home Financials for this Owner
Home Financials are based on the most recent Mortgage that was taken out on this home.
Original Mortgage
$44,400
Interest Rate
7.14%
Mortgage Type
FHA
Create a Home Valuation Report for This Property
The Home Valuation Report is an in-depth analysis detailing your home's value as well as a comparison with similar homes in the area
Home Values in the Area
Average Home Value in this Area
Purchase History
| Date | Buyer | Sale Price | Title Company |
|---|---|---|---|
| Springlake Home Solutions Llc | -- | None Listed On Document | |
| Nunez-Ramirez Leticia | -- | None Listed On Document | |
| Yousuf Mohammad M | -- | -- |
Source: Public Records
Mortgage History
| Date | Status | Borrower | Loan Amount |
|---|---|---|---|
| Open | Springlake Home Solutions Llc | $140,000 | |
| Previous Owner | Yousuf Mohammad M | $44,400 |
Source: Public Records
Tax History
| Year | Tax Paid | Tax Assessment Tax Assessment Total Assessment is a certain percentage of the fair market value that is determined by local assessors to be the total taxable value of land and additions on the property. | Land | Improvement |
|---|---|---|---|---|
| 2025 | $4,122 | $192,800 | $29,490 | $163,310 |
| 2024 | $4,122 | $192,800 | $29,490 | $163,310 |
| 2023 | $4,122 | $168,700 | $29,490 | $139,210 |
| 2022 | $3,890 | $168,700 | $29,490 | $139,210 |
| 2021 | $3,351 | $138,580 | $29,490 | $109,090 |
| 2020 | $3,477 | $138,580 | $29,490 | $109,090 |
| 2019 | $3,195 | $120,500 | $29,490 | $91,010 |
| 2018 | $2,844 | $106,040 | $18,430 | $87,610 |
| 2017 | $2,175 | $80,740 | $18,430 | $62,310 |
| 2016 | $1,818 | $67,480 | $18,430 | $49,050 |
| 2015 | $1,882 | $67,480 | $18,430 | $49,050 |
| 2014 | $1,882 | $69,890 | $18,430 | $51,460 |
Source: Public Records
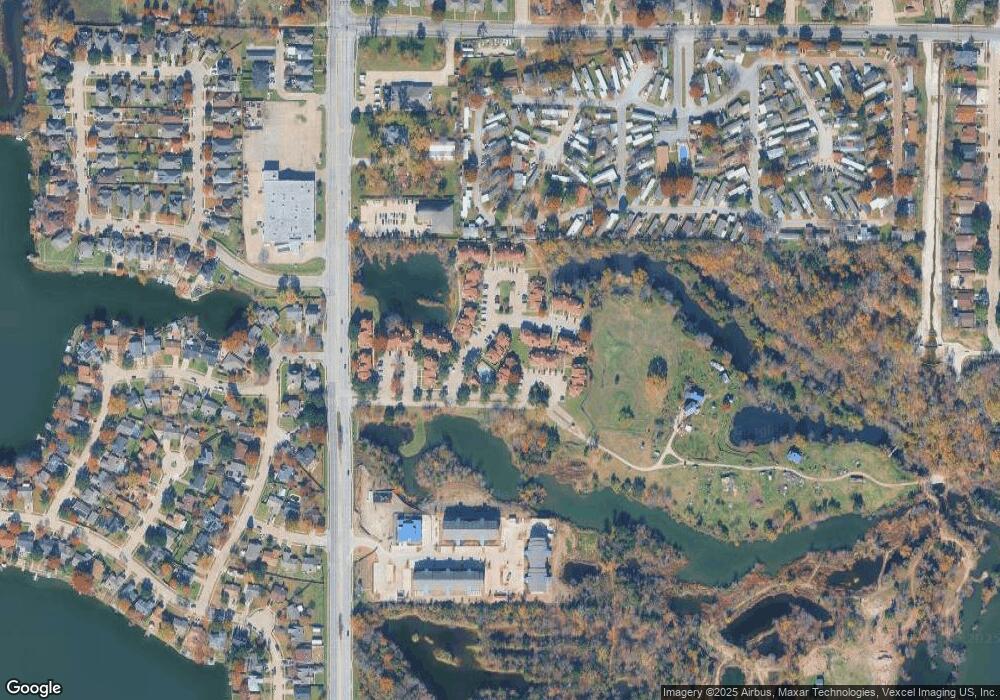
Map
Nearby Homes
- 1025 Turtle Lake Blvd Unit 111
- 920 Turtle Cove Unit 252
- 941 Turtle Cove Unit 129
- 910 Turtle Cove Unit 148
- 1133 Bay Side Dr
- 805 Cove Hollow
- 500 Seagull Ct
- 1716 Creek Ridge Ct
- 2713 Harvest Lake Dr
- 1514 Westwood Dr
- 1900 Robinson St
- 1905 Franklin St
- 2810 Harvest Lake Dr
- 1605 Ronne Dr
- 2128 Cay Ct
- 1504 Phillip Ct
- 1409 Barbara Dr
- 2413 Markland St
- 2001 Pebblebrook Trail
- 2016 Meadow Lark
- 930 Turtle Cove
- 934N Turtle Cove Unit 156
- 934 Turtle Cove Unit 156
- 928 Turtle Cove Unit 154
- 924N Turtle Cove Unit 253
- 926 Turtle Cove Unit 153
- 926 Turtle Cove Unit 153
- 929 Turtle Lake Blvd Unit 160
- 927 Turtle Lake Blvd Unit 159
- 925 Turtle Lake Blvd Unit 158
- 925 Turtle Lake Blvd Unit 158
- 916M Turtle Cove Unit 150
- 923 Turtle Lake Blvd Unit 157
- 932 Turtle Cove Unit 256
- 932 Turtle Cove
- 932 Turtle Cove Unit 256
- 959 Turtle Cove Unit 123
- 951G Turtle Cove Unit 126
- 959F Turtle Cove Unit 123
- 961F Turtle Cove Unit 122
Your Personal Tour Guide
Ask me questions while you tour the home.