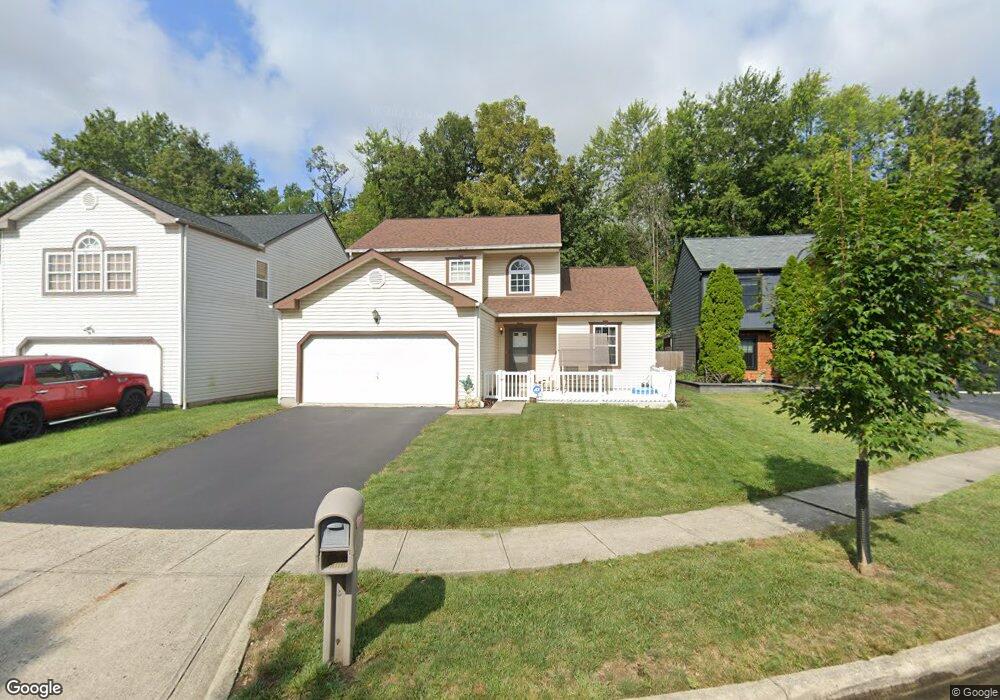
931 Fenvale Ln Galloway, OH 43119
Westbend NeighborhoodEstimated Value: $320,000 - $348,000
3
Beds
3
Baths
1,936
Sq Ft
$170/Sq Ft
Est. Value
About This Home
This home is located at 931 Fenvale Ln, Galloway, OH 43119 and is currently estimated at $328,551, approximately $169 per square foot. 931 Fenvale Ln is a home located in Franklin County with nearby schools including Georgian Heights Alt Elementary School, Wedgewood Middle School, and Briggs High School.
Ownership History
Date
Name
Owned For
Owner Type
Purchase Details
Closed on
May 20, 2025
Sold by
Berning Karen Sue
Bought by
Starkey Michelle R
Current Estimated Value
Purchase Details
Closed on
Jul 23, 2011
Sold by
Berning Karen S and Starkey Michelle R
Bought by
Berning Karen S
Purchase Details
Closed on
Sep 4, 2008
Sold by
Burnett Alexander F and Burnett Katrina J
Bought by
Berning Karen S and Starkey Michelle R
Purchase Details
Closed on
Sep 30, 2004
Sold by
Maronda Homes Inc
Bought by
Burnett Alexander F
Home Financials for this Owner
Home Financials are based on the most recent Mortgage that was taken out on this home.
Original Mortgage
$136,010
Interest Rate
5.89%
Mortgage Type
FHA
Purchase Details
Closed on
Apr 1, 2003
Sold by
Parkmead Corp
Bought by
Maronda Hones Inc Of Ohio
Create a Home Valuation Report for This Property
The Home Valuation Report is an in-depth analysis detailing your home's value as well as a comparison with similar homes in the area
Home Values in the Area
Average Home Value in this Area
Purchase History
| Date | Buyer | Sale Price | Title Company |
|---|---|---|---|
| Starkey Michelle R | -- | None Listed On Document | |
| Berning Karen S | -- | Attorney | |
| Berning Karen S | $140,000 | Title First | |
| Burnett Alexander F | $142,900 | Chicago Tit | |
| Maronda Hones Inc Of Ohio | $352,000 | -- |
Source: Public Records
Mortgage History
| Date | Status | Borrower | Loan Amount |
|---|---|---|---|
| Previous Owner | Burnett Alexander F | $136,010 |
Source: Public Records
Tax History Compared to Growth
Tax History
| Year | Tax Paid | Tax Assessment Tax Assessment Total Assessment is a certain percentage of the fair market value that is determined by local assessors to be the total taxable value of land and additions on the property. | Land | Improvement |
|---|---|---|---|---|
| 2024 | $3,581 | $89,600 | $25,200 | $64,400 |
| 2023 | $3,564 | $89,600 | $25,200 | $64,400 |
| 2022 | $2,823 | $63,180 | $9,240 | $53,940 |
| 2021 | $2,828 | $63,180 | $9,240 | $53,940 |
| 2020 | $2,832 | $63,180 | $9,240 | $53,940 |
| 2019 | $2,640 | $52,260 | $7,700 | $44,560 |
| 2018 | $2,639 | $52,260 | $7,700 | $44,560 |
| 2017 | $2,638 | $52,260 | $7,700 | $44,560 |
| 2016 | $2,419 | $45,260 | $8,300 | $36,960 |
| 2015 | $2,722 | $45,260 | $8,300 | $36,960 |
| 2014 | $2,806 | $45,260 | $8,300 | $36,960 |
| 2013 | $1,457 | $47,635 | $8,715 | $38,920 |
Source: Public Records
Map
Nearby Homes
- 976 Meadow Downs Trail
- 6567 Hall Rd
- 6532 Birch Park Dr
- 6351 Greenhaven Ave
- 6317 Oak Trail Dr
- 6699 Hall Rd
- 669 Gleaming Dr Unit 248
- 634 Gleaming Dr Unit 180
- 603 Gleaming Dr Unit 259
- 6109 Nasby Dr
- 813 Sumter St
- 6059 Chidley St
- 1058 Rousseau Ln
- 6024 Winterberry Dr
- 1418 Tilia Ct
- 332 Rye St Unit Lot 53
- 320 Rye St Unit Lot 51
- 315 Rye St Unit Lot 121
- 314 Rye St Unit Lot 50
- 843 Spivey Ln
- 937 Fenvale Ln
- 925 Fenvale Ln
- 943 Fenvale Ln
- 919 Fenvale Ln
- 949 Fenvale Ln
- 6439 Sedgemere Ln
- 6452 Sedgemere Ln
- 6446 Sedgemere Ln
- 955 Fenvale Ln
- 6440 Sedgemere Ln
- 945 Meadow Downs Trail
- 939 Meadow Downs Trail
- 951 Meadow Downs Trail
- 933 Meadow Downs Trail
- 6434 Sedgemere Ln
- 961 Fenvale Ln
- 927 Meadow Downs Trail
- 6428 Sedgemere Ln
- 969 Meadow Downs Trail
- 6420 Old Hall Rd