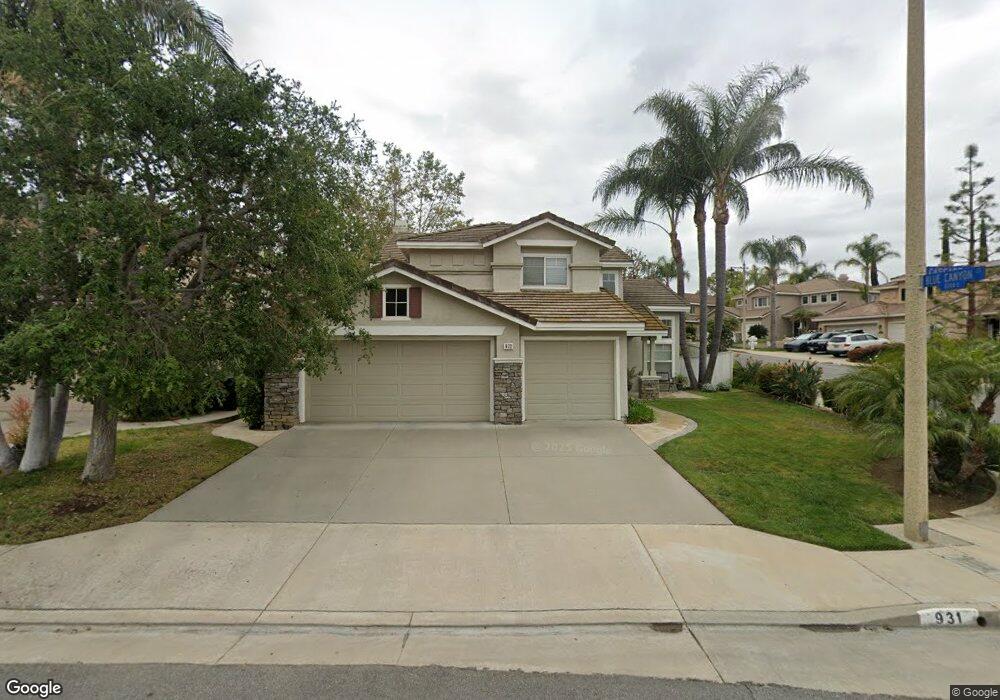
931 S Cascade Ln Anaheim, CA 92808
Anaheim Hills NeighborhoodEstimated Value: $1,265,389 - $1,371,000
4
Beds
3
Baths
2,125
Sq Ft
$623/Sq Ft
Est. Value
About This Home
This home is located at 931 S Cascade Ln, Anaheim, CA 92808 and is currently estimated at $1,323,097, approximately $622 per square foot. 931 S Cascade Ln is a home located in Orange County with nearby schools including Running Springs Elementary, Canyon High School, and El Rancho Charter.
Ownership History
Date
Name
Owned For
Owner Type
Purchase Details
Closed on
May 18, 2018
Sold by
Andre Ivn Joseph J and Andre Linda Kay
Bought by
Andre Joseph Jorge and Andre Linda Kay
Current Estimated Value
Purchase Details
Closed on
Feb 21, 1996
Sold by
Pucelli Eugene A and Pucelli Shirley A
Bought by
Andre Joseph J and Andre Linda Kay
Home Financials for this Owner
Home Financials are based on the most recent Mortgage that was taken out on this home.
Original Mortgage
$207,000
Interest Rate
7.41%
Mortgage Type
Balloon
Purchase Details
Closed on
Oct 2, 1993
Sold by
Kaufman And Broad South Coast Inc
Bought by
Pucelli Eugene A and Pucelli Shirley A
Home Financials for this Owner
Home Financials are based on the most recent Mortgage that was taken out on this home.
Original Mortgage
$232,700
Interest Rate
6.87%
Create a Home Valuation Report for This Property
The Home Valuation Report is an in-depth analysis detailing your home's value as well as a comparison with similar homes in the area
Home Values in the Area
Average Home Value in this Area
Purchase History
| Date | Buyer | Sale Price | Title Company |
|---|---|---|---|
| Andre Joseph Jorge | -- | None Available | |
| Andre Joseph J | $260,000 | Orange Coast Title | |
| Pucelli Eugene A | $245,000 | First American Title Ins Co |
Source: Public Records
Mortgage History
| Date | Status | Borrower | Loan Amount |
|---|---|---|---|
| Previous Owner | Andre Joseph J | $207,000 | |
| Previous Owner | Pucelli Eugene A | $232,700 |
Source: Public Records
Tax History Compared to Growth
Tax History
| Year | Tax Paid | Tax Assessment Tax Assessment Total Assessment is a certain percentage of the fair market value that is determined by local assessors to be the total taxable value of land and additions on the property. | Land | Improvement |
|---|---|---|---|---|
| 2025 | $4,794 | $431,917 | $137,030 | $294,887 |
| 2024 | $4,794 | $423,449 | $134,344 | $289,105 |
| 2023 | $4,685 | $415,147 | $131,710 | $283,437 |
| 2022 | $4,592 | $407,007 | $129,127 | $277,880 |
| 2021 | $4,464 | $399,027 | $126,595 | $272,432 |
| 2020 | $4,422 | $394,936 | $125,297 | $269,639 |
| 2019 | $4,367 | $387,193 | $122,841 | $264,352 |
| 2018 | $4,299 | $379,601 | $120,432 | $259,169 |
| 2017 | $4,123 | $372,158 | $118,070 | $254,088 |
| 2016 | $4,043 | $364,861 | $115,755 | $249,106 |
| 2015 | $3,930 | $359,381 | $114,016 | $245,365 |
| 2014 | $3,903 | $352,342 | $111,783 | $240,559 |
Source: Public Records
Map
Nearby Homes
- 8314 E Quiet Canyon Ct
- 961 S Lone Pine Ln
- 1012 S Silver Star Way
- 927 S Lone Pine Ln
- 922 S Country Glen Way
- 8420 E Tioga Way Unit 185
- 7917 E Viewrim Dr
- 1008 S Rossano Way Unit 20
- 1232 S Country Glen Way
- 1041 S San Marino Way
- 7921 E Quinn Dr
- 0 None Unit IG24141451
- 8102 E Santo Ct
- 1062 S Romano Ct
- 1063 S Taylor Ct
- 7839 E Viewrim Dr
- 8027 E Naples Ln
- 8025 E Sandstone Dr
- 8039 E Snapdragon Ln Unit 6
- 911 S Firefly Dr
- 941 S Cascade Ln
- 951 S Cascade Ln
- 8266 E Blue Canyon Ct
- 8293 E Blue Canyon Ct
- 8263 E Blue Canyon Ct
- 942 S Cascade Ln
- 932 S Cascade Ln
- 8233 E Blue Canyon Ct
- 8236 E Blue Canyon Ct
- 961 S Cascade Ln
- 8203 E Blue Canyon Ct
- 952 S Cascade Ln
- 922 S Cascade Ln
- 8206 E Blue Canyon Ct
- 912 S Cascade Ln
- 962 S Cascade Ln
- 905 S Cascade Ln
- 902 S Cascade Ln
- 972 S Cascade Ln
- 930 S Hanlon Way