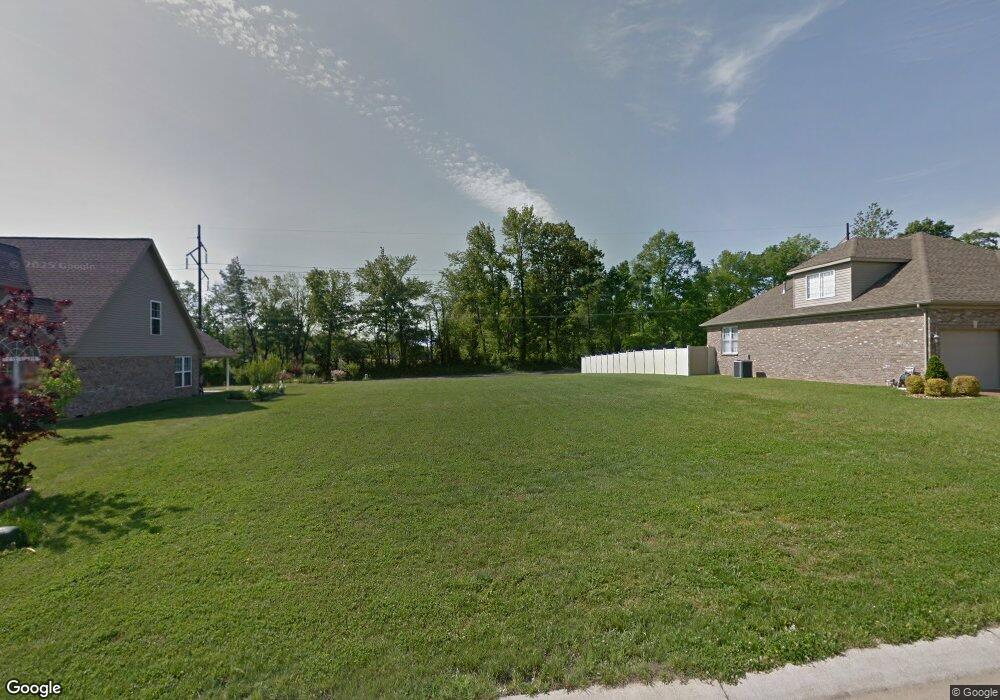
9311 Millicent Ct Newburgh, IN 47630
Estimated Value: $391,885 - $403,000
3
Beds
3
Baths
2,036
Sq Ft
$195/Sq Ft
Est. Value
About This Home
This home is located at 9311 Millicent Ct, Newburgh, IN 47630 and is currently estimated at $396,971, approximately $194 per square foot. 9311 Millicent Ct is a home with nearby schools including John H. Castle Elementary School, Castle North Middle School, and Castle High School.
Ownership History
Date
Name
Owned For
Owner Type
Purchase Details
Closed on
Jul 17, 2014
Sold by
Maken Corporation
Bought by
Byrley Mark E and Byrley Barbara A
Current Estimated Value
Home Financials for this Owner
Home Financials are based on the most recent Mortgage that was taken out on this home.
Original Mortgage
$90,000
Outstanding Balance
$28,513
Interest Rate
4.12%
Mortgage Type
New Conventional
Estimated Equity
$368,458
Create a Home Valuation Report for This Property
The Home Valuation Report is an in-depth analysis detailing your home's value as well as a comparison with similar homes in the area
Home Values in the Area
Average Home Value in this Area
Purchase History
| Date | Buyer | Sale Price | Title Company |
|---|---|---|---|
| Byrley Mark E | -- | Lockyear Title Llc |
Source: Public Records
Mortgage History
| Date | Status | Borrower | Loan Amount |
|---|---|---|---|
| Open | Byrley Mark E | $90,000 |
Source: Public Records
Tax History Compared to Growth
Tax History
| Year | Tax Paid | Tax Assessment Tax Assessment Total Assessment is a certain percentage of the fair market value that is determined by local assessors to be the total taxable value of land and additions on the property. | Land | Improvement |
|---|---|---|---|---|
| 2024 | $2,906 | $369,300 | $62,900 | $306,400 |
| 2023 | $3,050 | $389,700 | $63,800 | $325,900 |
| 2022 | $2,947 | $360,400 | $55,500 | $304,900 |
| 2021 | $2,764 | $319,700 | $54,300 | $265,400 |
| 2020 | $2,652 | $296,000 | $50,900 | $245,100 |
| 2019 | $2,566 | $283,100 | $45,100 | $238,000 |
| 2018 | $2,447 | $281,000 | $45,100 | $235,900 |
| 2017 | $2,384 | $276,300 | $45,100 | $231,200 |
| 2016 | $2,370 | $276,300 | $45,100 | $231,200 |
| 2014 | $585 | $41,400 | $41,400 | $0 |
| 2013 | $18 | $1,200 | $1,200 | $0 |
Source: Public Records
Map
Nearby Homes
- 4700 Clint Cir
- 4500 Clint Cir
- 4144 Forest Green Dr
- 9076 Halston Cir
- 4200 Hare Ct
- 4011 Frame Rd
- 9722 Rabbit Run Dr
- 8855 Framewood Dr
- 4422 Wynbrooke Dr
- 4133 Secretariat Dr
- 8633 Outer Lincoln Ave
- 9954 Ella Cir
- 3895 High Pointe Dr
- 3879 High Pointe Dr
- 8634 Briarose Ct
- 700 Coppers Edge Dr
- 10395 Indiana 66
- 9856 Arbor Lake Dr
- 4455 E Lincoln Dr
- 0 Willow Pond Rd
- 9333 Millicent Ct
- 9300 Millicent Ct
- 9322 Millicent Ct
- 9288 Millicent Ct
- 9344 Millicent Ct
- 4478 Huntington Ridge Cir
- 4468 Huntington Ridge Cir
- 9377 Millicent Ct
- 9311 Emily Ct
- 4458 Huntington Ridge Cir
- 9299 Emily Ct
- 9333 Emily Ct
- 9355 Emily Ct
- 4448 Huntington Ridge Cir
- 4660 Clint Cir
- 9399 Millicent Ct
- 4650 Clint Cir
- 9377 Emily Ct
- 9388 Millicent Ct
- 4670 Clint Cir