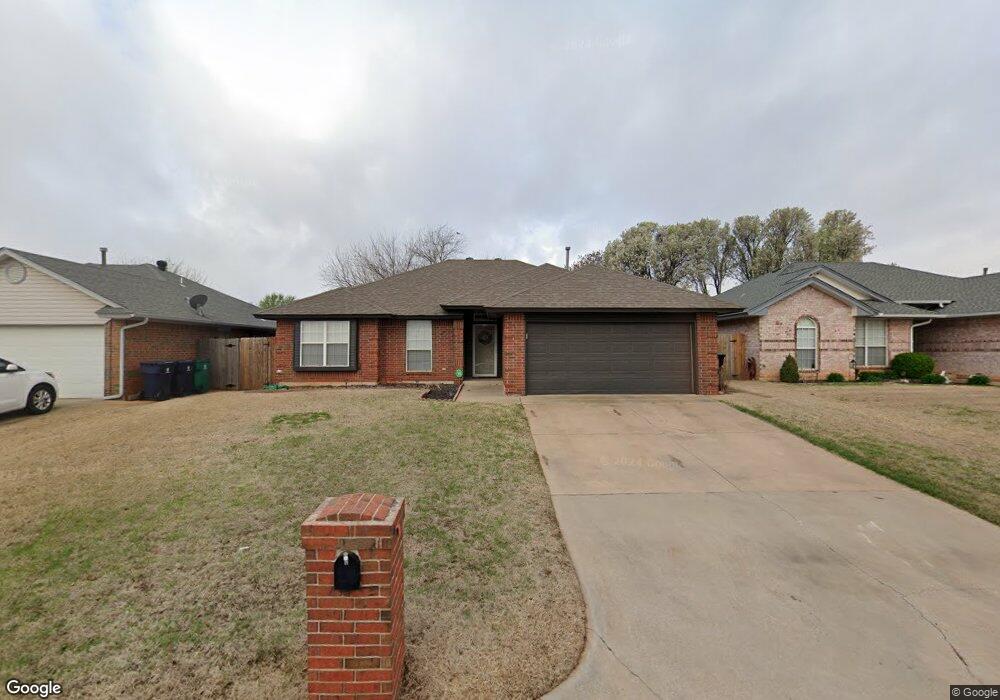
9313 S Bryant Terrace Unit 9315 Moore, OK 73160
Bryant NeighborhoodEstimated Value: $189,000 - $218,000
3
Beds
2
Baths
1,340
Sq Ft
$152/Sq Ft
Est. Value
About This Home
This home is located at 9313 S Bryant Terrace Unit 9315, Moore, OK 73160 and is currently estimated at $203,855, approximately $152 per square foot. 9313 S Bryant Terrace Unit 9315 is a home located in Cleveland County with nearby schools including Bryant Elementary School, Central Junior High School, and Moore High School.
Ownership History
Date
Name
Owned For
Owner Type
Purchase Details
Closed on
May 3, 2021
Sold by
Bales Kelly Duane and Bales Desiree
Bought by
Davis Chad
Current Estimated Value
Home Financials for this Owner
Home Financials are based on the most recent Mortgage that was taken out on this home.
Original Mortgage
$136,482
Outstanding Balance
$123,687
Interest Rate
3.1%
Mortgage Type
FHA
Estimated Equity
$80,168
Purchase Details
Closed on
Sep 25, 2009
Sold by
Camacho Raynaldo and Camacho Mary Alice
Bought by
Bales Ii Kelly Duane
Home Financials for this Owner
Home Financials are based on the most recent Mortgage that was taken out on this home.
Original Mortgage
$116,451
Interest Rate
5.36%
Mortgage Type
VA
Purchase Details
Closed on
Jul 10, 2003
Sold by
Mcgee Kathryn-Trust
Bought by
Camacho Raynaldo and Mary Alice
Create a Home Valuation Report for This Property
The Home Valuation Report is an in-depth analysis detailing your home's value as well as a comparison with similar homes in the area
Home Values in the Area
Average Home Value in this Area
Purchase History
| Date | Buyer | Sale Price | Title Company |
|---|---|---|---|
| Davis Chad | $139,000 | First American Title | |
| Bales Ii Kelly Duane | $114,000 | Stewart Abstract & Title Of | |
| Camacho Raynaldo | $90,000 | -- |
Source: Public Records
Mortgage History
| Date | Status | Borrower | Loan Amount |
|---|---|---|---|
| Open | Davis Chad | $136,482 | |
| Previous Owner | Bales Ii Kelly Duane | $116,451 |
Source: Public Records
Tax History Compared to Growth
Tax History
| Year | Tax Paid | Tax Assessment Tax Assessment Total Assessment is a certain percentage of the fair market value that is determined by local assessors to be the total taxable value of land and additions on the property. | Land | Improvement |
|---|---|---|---|---|
| 2024 | $2,395 | $19,668 | $3,769 | $15,899 |
| 2023 | $2,290 | $18,732 | $3,856 | $14,876 |
| 2022 | $2,210 | $17,840 | $4,200 | $13,640 |
| 2021 | $1,916 | $15,502 | $4,073 | $11,429 |
| 2020 | $1,833 | $14,764 | $4,043 | $10,721 |
| 2019 | $1,764 | $14,061 | $2,400 | $11,661 |
| 2018 | $1,784 | $14,061 | $2,400 | $11,661 |
| 2017 | $1,786 | $14,061 | $0 | $0 |
| 2016 | $1,804 | $14,061 | $2,400 | $11,661 |
| 2015 | -- | $13,663 | $2,332 | $11,331 |
| 2014 | -- | $13,013 | $1,200 | $11,813 |
Source: Public Records
Map
Nearby Homes
- 2924 SE 96th St
- 2716 SE 92nd Cir
- 3308 SE 89th St Unit 402
- 9628 Gabriel Dr
- 2508 SE 92nd Terrace
- 9629 Eli Dr
- 1632 NE 35th St
- 9620 Eli Dr
- 2612 SE 97th St
- 9632 Eli Dr
- 1821 NE 31st St
- 9637 Silas Dr
- 1717 NE 31st St
- 1508 NE 33rd Terrace
- 1624 NE 32nd St
- 1500 NE 33rd Terrace
- 2333 SE 89th Terrace
- 3800 SE 89th St
- 2329 SE 89th Terrace
- 9016 Blackfork Ln
- 9317 S Bryant Terrace
- 9309 S Bryant Terrace
- 9401 S Bryant Terrace
- 9305 S Bryant Terrace
- 9316 Buttonfield Ave
- 9314 Buttonfield Ave
- 9308 Buttonfield Ave
- 9400 Buttonfield Ave
- 9312 S Bryant Terrace
- 9316 S Bryant Terrace
- 9308 S Bryant Terrace
- 9306 Buttonfield Ave
- 9405 S Bryant Terrace
- 9301 S Bryant Terrace
- 9306 S Bryant Terrace
- 9402 S Bryant Terrace
- 9404 Buttonfield Ave
- 9300 Buttonfield Ave
- 9409 S Bryant Terrace
- 9213 S Bryant Terrace