932 Augusta Cir Napa, CA 94558
Silverado Resort NeighborhoodEstimated Value: $1,665,253 - $1,921,000
3
Beds
4
Baths
2,220
Sq Ft
$793/Sq Ft
Est. Value
About This Home
This home is located at 932 Augusta Cir, Napa, CA 94558 and is currently estimated at $1,759,418, approximately $792 per square foot. 932 Augusta Cir is a home located in Napa County with nearby schools including Vichy Elementary School, Silverado Middle School, and Vintage High School.
Ownership History
Date
Name
Owned For
Owner Type
Purchase Details
Closed on
May 14, 2013
Sold by
Patch Richard R
Bought by
Patch Richard R and Richard R Patch Revocable Trus
Current Estimated Value
Purchase Details
Closed on
Apr 27, 2013
Sold by
Smith Timothy and Mabry Pamela
Bought by
Smith Timothy E and Mabry Pamela M
Purchase Details
Closed on
Jan 9, 2013
Sold by
Patch Darlene L
Bought by
Patch Richard R
Purchase Details
Closed on
Feb 21, 2002
Sold by
Markstein Robert C and Markstein Brenda A
Bought by
Patch Richard R and Patch Darlene L
Home Financials for this Owner
Home Financials are based on the most recent Mortgage that was taken out on this home.
Original Mortgage
$430,000
Outstanding Balance
$174,529
Interest Rate
6.8%
Mortgage Type
Stand Alone First
Estimated Equity
$1,584,889
Create a Home Valuation Report for This Property
The Home Valuation Report is an in-depth analysis detailing your home's value as well as a comparison with similar homes in the area
Home Values in the Area
Average Home Value in this Area
Purchase History
| Date | Buyer | Sale Price | Title Company |
|---|---|---|---|
| Patch Richard R | -- | None Available | |
| Smith Timothy E | -- | None Available | |
| Patch Richard R | -- | None Available | |
| Patch Richard R | $930,000 | First American Title Co |
Source: Public Records
Mortgage History
| Date | Status | Borrower | Loan Amount |
|---|---|---|---|
| Open | Patch Richard R | $430,000 |
Source: Public Records
Tax History
| Year | Tax Paid | Tax Assessment Tax Assessment Total Assessment is a certain percentage of the fair market value that is determined by local assessors to be the total taxable value of land and additions on the property. | Land | Improvement |
|---|---|---|---|---|
| 2025 | $16,012 | $1,373,874 | $738,644 | $635,230 |
| 2024 | $15,489 | $1,346,936 | $724,161 | $622,775 |
| 2023 | $15,489 | $1,320,526 | $709,962 | $610,564 |
| 2022 | $15,043 | $1,294,635 | $696,042 | $598,593 |
| 2021 | $14,847 | $1,269,251 | $682,395 | $586,856 |
| 2020 | $14,756 | $1,256,237 | $675,398 | $580,839 |
| 2019 | $14,473 | $1,231,605 | $662,155 | $569,450 |
| 2018 | $14,303 | $1,207,457 | $649,172 | $558,285 |
| 2017 | $14,035 | $1,183,783 | $636,444 | $547,339 |
| 2016 | $13,817 | $1,160,572 | $623,965 | $536,607 |
| 2015 | $12,957 | $1,143,140 | $614,593 | $528,547 |
| 2014 | $12,771 | $1,120,748 | $602,554 | $518,194 |
Source: Public Records
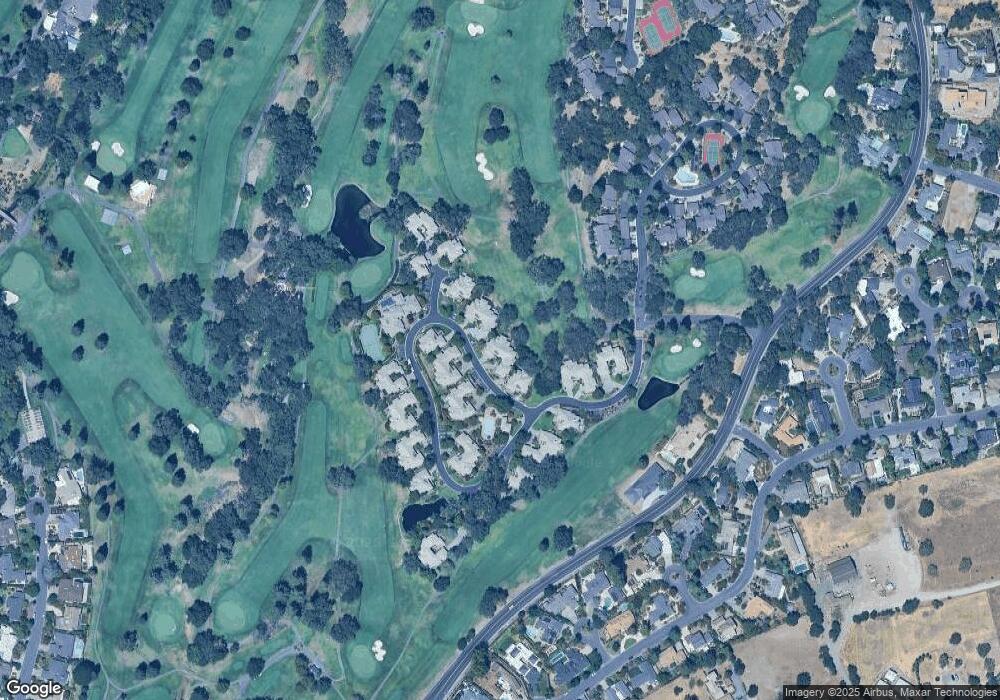
Map
Nearby Homes
- 833 Augusta Cir Unit 34
- 808 Augusta Cir
- 2186 Monticello Rd
- 19 Inverness Dr
- 868 Oak Leaf Way
- 389 Saint Andrews Dr
- 23 Saint Michael Cir
- 14 Maui Way
- 377 Troon Dr
- 1600 Atlas Peak Rd Unit 383-4
- 350 Deer Hollow Dr
- 2277 Monticello Rd
- 209 Kaanapali Dr
- 1166 Castle Oaks Dr
- 162 Bonnie Brook Dr
- 1161 Castle Oaks Dr
- 540 Westgate Dr
- 1150 Castle Oaks Dr
- 1860 Mckinley Rd
- 1143 Castle Oaks Dr
- 928 Augusta Cir
- 936 Augusta Cir
- 920 Augusta Cir
- 940 Augusta Cir Unit 8
- 941 Augusta Cir Unit 30
- 937 Augusta Cir Unit 29
- 933 Augusta Cir
- 945 Augusta Cir
- 1000 Augusta Ct
- 929 Augusta Cir Unit 27
- 908 Augusta Cir Unit 3
- 904 Augusta Cir
- 994 Augusta Cir
- 975 Augusta Cir Unit 26
- 950 Augusta Cir
- 990 Augusta Cir
- 1004 Augusta Ct Unit 10
- 1012 Augusta Ct
- 900 Augusta Cir Unit 1
- 986 Augusta Cir
Your Personal Tour Guide
Ask me questions while you tour the home.