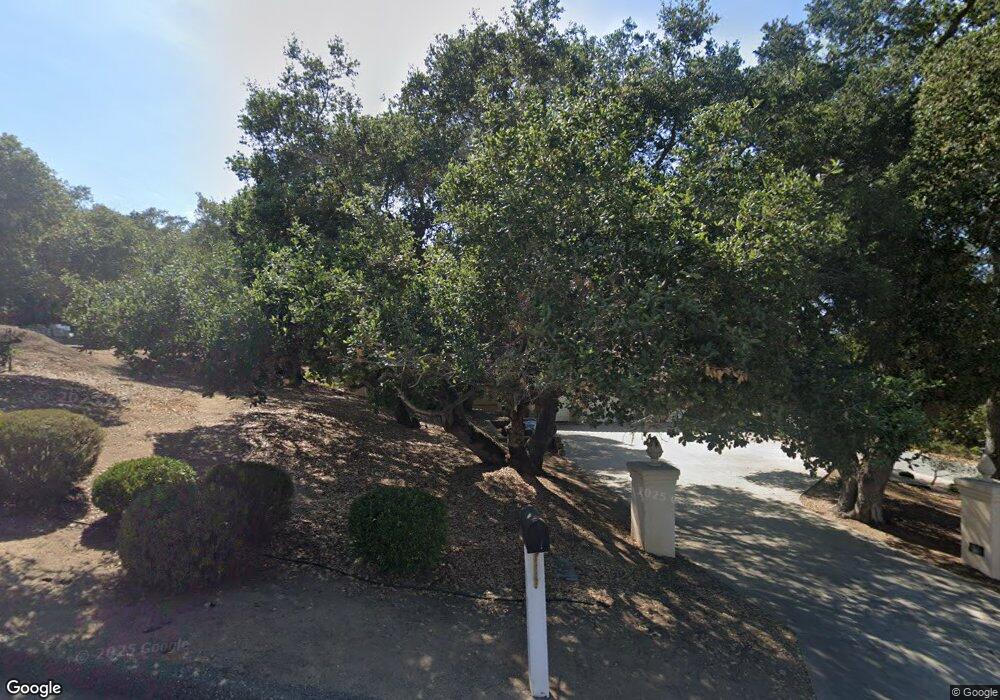
932 Cascada Ln Nipomo, CA 93444
Estimated Value: $1,391,000 - $1,467,000
3
Beds
3
Baths
3,037
Sq Ft
$471/Sq Ft
Est. Value
About This Home
This home is located at 932 Cascada Ln, Nipomo, CA 93444 and is currently estimated at $1,430,345, approximately $470 per square foot. 932 Cascada Ln is a home located in San Luis Obispo County with nearby schools including Dana Elementary School, Mesa Middle School, and Nipomo High School.
Ownership History
Date
Name
Owned For
Owner Type
Purchase Details
Closed on
Dec 21, 2016
Sold by
Moore James G and Moore Carole M
Bought by
Moore James G and Moore Carole M
Current Estimated Value
Home Financials for this Owner
Home Financials are based on the most recent Mortgage that was taken out on this home.
Original Mortgage
$40,000
Interest Rate
3.57%
Mortgage Type
Unknown
Purchase Details
Closed on
Jul 11, 2014
Sold by
Moore James and Moore Carole
Bought by
The Moore Living Trust
Create a Home Valuation Report for This Property
The Home Valuation Report is an in-depth analysis detailing your home's value as well as a comparison with similar homes in the area
Home Values in the Area
Average Home Value in this Area
Purchase History
| Date | Buyer | Sale Price | Title Company |
|---|---|---|---|
| Moore James G | -- | Accommodation | |
| Moore James G | -- | Fidelity National Title | |
| The Moore Living Trust | -- | None Available |
Source: Public Records
Mortgage History
| Date | Status | Borrower | Loan Amount |
|---|---|---|---|
| Closed | Moore James G | $40,000 |
Source: Public Records
Tax History Compared to Growth
Tax History
| Year | Tax Paid | Tax Assessment Tax Assessment Total Assessment is a certain percentage of the fair market value that is determined by local assessors to be the total taxable value of land and additions on the property. | Land | Improvement |
|---|---|---|---|---|
| 2025 | $7,141 | $701,371 | $370,712 | $330,659 |
| 2024 | $7,058 | $687,620 | $363,444 | $324,176 |
| 2023 | $7,058 | $674,138 | $356,318 | $317,820 |
| 2022 | $6,950 | $660,921 | $349,332 | $311,589 |
| 2021 | $6,935 | $647,963 | $342,483 | $305,480 |
| 2020 | $6,855 | $641,320 | $338,972 | $302,348 |
| 2019 | $6,812 | $628,746 | $332,326 | $296,420 |
| 2018 | $6,729 | $616,418 | $325,810 | $290,608 |
| 2017 | $6,602 | $604,332 | $319,422 | $284,910 |
| 2016 | $6,225 | $592,483 | $313,159 | $279,324 |
| 2015 | $6,134 | $583,585 | $308,456 | $275,129 |
| 2014 | $5,906 | $572,154 | $302,414 | $269,740 |
Source: Public Records
Map
Nearby Homes
- 620 Camino Roble
- 1010 1012 Upper Los Berros Rd
- 615 Sweet Donna Place
- 875 Camino Caballo
- 219 Lema Dr
- 7855 Suey Creek Rd
- 217 Hope Way
- 940 Calle Fresa
- 228 Chaparral Ln
- 255 Encino Ln
- 759 Viola Ct
- 719 W Tefft St
- 1225 Dawn Rd
- 1150 Redberry Place
- 680 Hill St
- 261 Hazel Ln
- Mesa Plan at Hill Street Terraces - Hill Street Series
- Pacific Plan at Hill Street Terraces - Hill Street Series
- Monarch Plan at Hill Street Terraces - Hill Street Series
- Rancho Plan at Hill Street Terraces - Hill Street Series
- 936 Cascada Ln
- 700 Whimbrel Ct
- 933 Cascada Ln
- 921 Cascada Ln
- 714 Whimbrel Ct
- 708 Whimbrel Ct
- 950 Red Gum Ln
- 915 Cascada Ln
- 947 Cascada Ln
- 725 Whimbrel Ct
- 925 Cascada Ln
- 955 Red Gum Ln
- 720 Whimbrel Ct
- 964 Red Gum Ln
- 905 Cascada Ln
- 963 Silver Dollar Ln
- 955 Silver Dollar Ln
- 975 Red Gum Ln Unit LOT1
- 975 Red Gum Ln