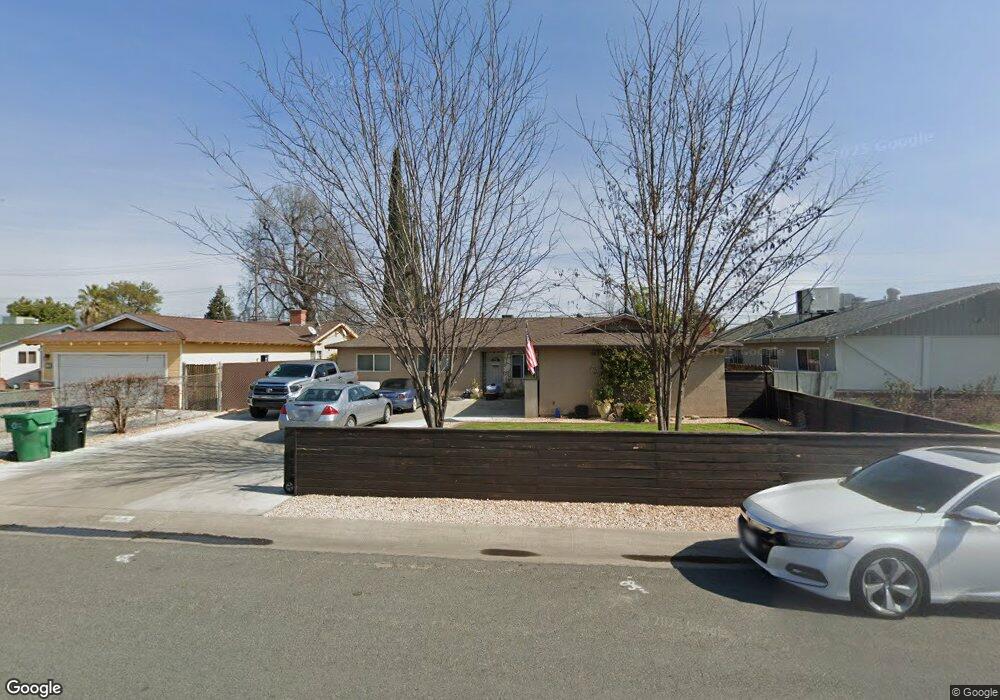
932 N Belmont St Porterville, CA 93257
Porterville Northwest NeighborhoodEstimated Value: $300,769 - $358,000
3
Beds
2
Baths
1,466
Sq Ft
$226/Sq Ft
Est. Value
About This Home
This home is located at 932 N Belmont St, Porterville, CA 93257 and is currently estimated at $330,942, approximately $225 per square foot. 932 N Belmont St is a home located in Tulare County with nearby schools including Oak Grove Elementary School, Burton Middle School, and Monache High School.
Ownership History
Date
Name
Owned For
Owner Type
Purchase Details
Closed on
Nov 25, 2015
Sold by
Monzon Ramiro
Bought by
Khamninh Alane
Current Estimated Value
Home Financials for this Owner
Home Financials are based on the most recent Mortgage that was taken out on this home.
Original Mortgage
$151,210
Outstanding Balance
$117,548
Interest Rate
3.37%
Mortgage Type
FHA
Estimated Equity
$213,394
Purchase Details
Closed on
Jan 22, 2009
Sold by
Monzon Ramiro
Bought by
Monzon Ramiro and Zayas Esther
Purchase Details
Closed on
Jan 16, 2001
Sold by
Hud
Bought by
Monzon Ramiro
Home Financials for this Owner
Home Financials are based on the most recent Mortgage that was taken out on this home.
Original Mortgage
$60,000
Interest Rate
7.54%
Purchase Details
Closed on
Aug 10, 2000
Sold by
Principal Residential Mtg Inc
Bought by
Hud
Purchase Details
Closed on
Aug 8, 2000
Sold by
Hunting Charles E
Bought by
Principal Residential Mtg Inc
Create a Home Valuation Report for This Property
The Home Valuation Report is an in-depth analysis detailing your home's value as well as a comparison with similar homes in the area
Home Values in the Area
Average Home Value in this Area
Purchase History
| Date | Buyer | Sale Price | Title Company |
|---|---|---|---|
| Khamninh Alane | $154,000 | Chicago Title Co | |
| Monzon Ramiro | -- | None Available | |
| Monzon Ramiro | $68,000 | Fidelity National Title | |
| Hud | -- | First American Title Ins Co | |
| Principal Residential Mtg Inc | $82,010 | First American Title Ins Co |
Source: Public Records
Mortgage History
| Date | Status | Borrower | Loan Amount |
|---|---|---|---|
| Open | Khamninh Alane | $151,210 | |
| Previous Owner | Monzon Ramiro | $60,000 |
Source: Public Records
Tax History Compared to Growth
Tax History
| Year | Tax Paid | Tax Assessment Tax Assessment Total Assessment is a certain percentage of the fair market value that is determined by local assessors to be the total taxable value of land and additions on the property. | Land | Improvement |
|---|---|---|---|---|
| 2025 | $2,090 | $182,302 | $41,431 | $140,871 |
| 2024 | $2,090 | $178,728 | $40,619 | $138,109 |
| 2023 | $2,095 | $175,224 | $39,823 | $135,401 |
| 2022 | $2,021 | $171,790 | $39,043 | $132,747 |
| 2021 | $1,993 | $168,421 | $38,277 | $130,144 |
| 2020 | $1,960 | $166,695 | $37,885 | $128,810 |
| 2019 | $1,959 | $163,426 | $37,142 | $126,284 |
| 2018 | $1,880 | $160,222 | $36,414 | $123,808 |
| 2017 | $1,853 | $157,080 | $35,700 | $121,380 |
| 2016 | $1,073 | $86,558 | $29,277 | $57,281 |
| 2015 | $887 | $85,258 | $28,837 | $56,421 |
| 2014 | $867 | $83,588 | $28,272 | $55,316 |
Source: Public Records
Map
Nearby Homes
- 1750 W Terry Cir
- 1691 Terry Ct
- 1644 Mccomb Ave
- 1857 W Westfield Ave
- 1041 Greenfield Dr
- 1681 W Wall Ln
- 1926 W Nancy Ave
- 1690 Memory Ln
- 1730 W Grand Ave
- 595 N Salisbury St
- 1121 N Lindale Way
- 2164 W San Lucia Ct
- 1076 N Beverly St
- 0 Pioneer Ave Unit 233651
- 1771 W Aurora Ct
- 2261 W San Lucia Ct
- Sydney Plan at Laurelwood
- Carlton Plan at Laurelwood
- Carmel Plan at Laurelwood
- Aspen with Loft Plan at Laurelwood
- 940 N Belmont St
- 920 N Belmont St
- 931 N Salisbury St
- 931 Salisbury St
- 954 N Belmont St
- 1770 Bel Aire Ave
- 1810 Bel Aire Ave
- 1810 Bel Aire Ave
- 1770 Bel Aire Ave
- 1770 W Bel Aire Ave
- 1780 Bel Aire Ave
- 1777 Terry Cir
- 931 N Belmont St
- 960 N Belmont St
- 919 N Belmont St
- 943 N Belmont St
- 951 N Belmont St
- 1840 Bel Aire Ave Unit 1
- 1840 Bel Aire Ave
- 1840 Bel Aire Ave