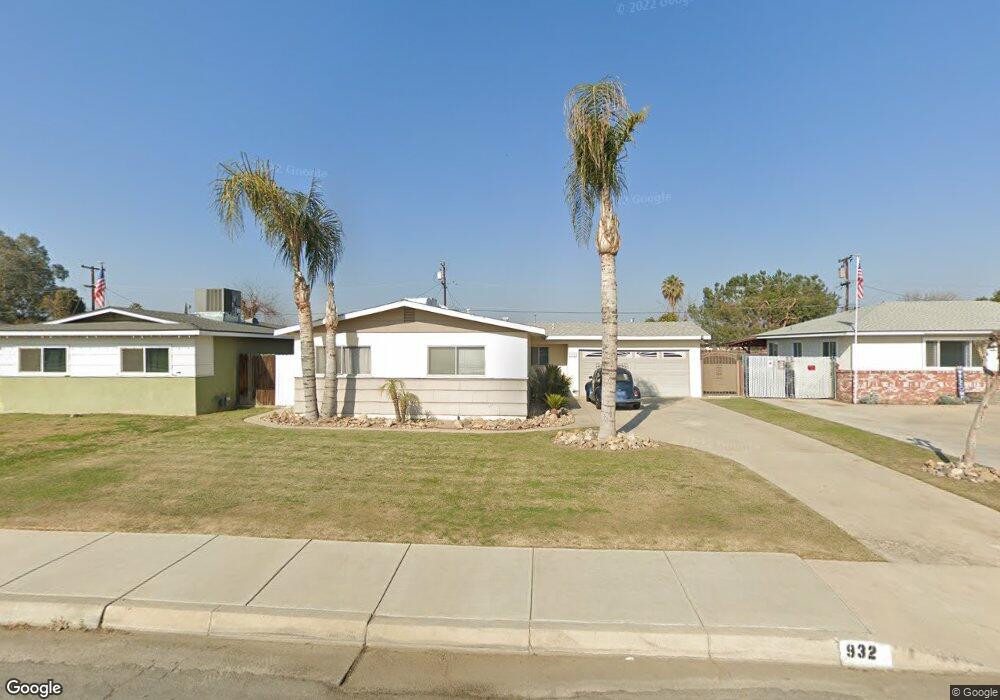
932 Roberts Ln Bakersfield, CA 93308
Estimated Value: $271,075 - $308,000
3
Beds
2
Baths
1,314
Sq Ft
$217/Sq Ft
Est. Value
About This Home
This home is located at 932 Roberts Ln, Bakersfield, CA 93308 and is currently estimated at $285,769, approximately $217 per square foot. 932 Roberts Ln is a home located in Kern County with nearby schools including Beardsley Elementary School, Beardsley Junior High School, and North High School.
Ownership History
Date
Name
Owned For
Owner Type
Purchase Details
Closed on
Aug 27, 2005
Sold by
Mendez Dianne Lynn
Bought by
Mendez Joe
Current Estimated Value
Purchase Details
Closed on
Feb 21, 1995
Sold by
Wilson David L and Wilson Debra J
Bought by
Mendez Joe and Mendez Diane
Home Financials for this Owner
Home Financials are based on the most recent Mortgage that was taken out on this home.
Original Mortgage
$78,778
Interest Rate
8.86%
Mortgage Type
FHA
Purchase Details
Closed on
Sep 12, 1994
Sold by
Wilson Robert L and Wilson David L
Bought by
Wilson David L and Wilson Debra J
Home Financials for this Owner
Home Financials are based on the most recent Mortgage that was taken out on this home.
Original Mortgage
$54,000
Interest Rate
8.58%
Purchase Details
Closed on
Mar 4, 1994
Sold by
Wilson Robert L
Bought by
Wilson Robert L and Wilson David L
Purchase Details
Closed on
Mar 18, 1986
Sold by
Va
Bought by
Wilson Robert L and Wilson Jacqueline L
Create a Home Valuation Report for This Property
The Home Valuation Report is an in-depth analysis detailing your home's value as well as a comparison with similar homes in the area
Home Values in the Area
Average Home Value in this Area
Purchase History
| Date | Buyer | Sale Price | Title Company |
|---|---|---|---|
| Mendez Joe | -- | -- | |
| Mendez Joe | $79,000 | Fidelity National Title | |
| Wilson David L | -- | World Title Company | |
| Wilson Robert L | -- | -- | |
| Wilson Robert L | -- | -- |
Source: Public Records
Mortgage History
| Date | Status | Borrower | Loan Amount |
|---|---|---|---|
| Previous Owner | Mendez Joe | $78,778 | |
| Previous Owner | Wilson David L | $54,000 |
Source: Public Records
Tax History Compared to Growth
Tax History
| Year | Tax Paid | Tax Assessment Tax Assessment Total Assessment is a certain percentage of the fair market value that is determined by local assessors to be the total taxable value of land and additions on the property. | Land | Improvement |
|---|---|---|---|---|
| 2025 | $2,529 | $132,665 | $25,178 | $107,487 |
| 2024 | $2,529 | $130,065 | $24,685 | $105,380 |
| 2023 | $2,464 | $127,515 | $24,201 | $103,314 |
| 2022 | $2,371 | $125,016 | $23,727 | $101,289 |
| 2021 | $2,280 | $122,565 | $23,262 | $99,303 |
| 2020 | $2,203 | $121,309 | $23,024 | $98,285 |
| 2019 | $2,182 | $121,309 | $23,024 | $98,285 |
| 2018 | $2,113 | $116,600 | $22,131 | $94,469 |
| 2017 | $2,076 | $114,315 | $21,698 | $92,617 |
| 2016 | $1,962 | $112,074 | $21,273 | $90,801 |
| 2015 | $1,912 | $110,392 | $20,954 | $89,438 |
| 2014 | $1,775 | $100,000 | $25,000 | $75,000 |
Source: Public Records
Map
Nearby Homes
- 1000 Redwood Dr
- 604 Teakwood Dr
- 216 Vivian Ln
- 210 Dogwood Ln
- 501 Belmont Ave Unit 16
- 324 Belmont Ave
- 258 Mary Kay Ln
- 4 Dogwood Ln
- 267 Teakwood Ln
- 256 Mary Kay Ln
- 1000 Olive Dr Unit 4
- 1000 Olive Dr Unit 9
- 818 Decatur St
- 48 Cedarwood Ln
- 5000 Pierce Rd Unit 17
- 5000 Pierce Rd Unit 30
- 63 Cinnamon Ln
- 144 Torrey Pines Ln
- 35 Cedarwood Ln
- 613 Belmont Ave
- 928 Roberts Ln
- 1000 Roberts Ln
- 924 Roberts Ln
- 1004 Roberts Ln
- 931 Mammoth Ave
- 929 Mammoth Ave
- 1001 Mammoth Ave
- 925 Mammoth Ave
- 920 Roberts Ln
- 1005 Mammoth Ave
- 921 Mammoth Ave
- 1009 Mammoth Ave
- 916 Roberts Ln
- 1012 Roberts Ln
- 917 Mammoth Ave
- 1013 Mammoth Ave
- 912 Roberts Ln
- 932 Mammoth Ave
- 928 Mammoth Ave