Estimated Value: $410,342 - $454,000
4
Beds
3
Baths
2,868
Sq Ft
$150/Sq Ft
Est. Value
About This Home
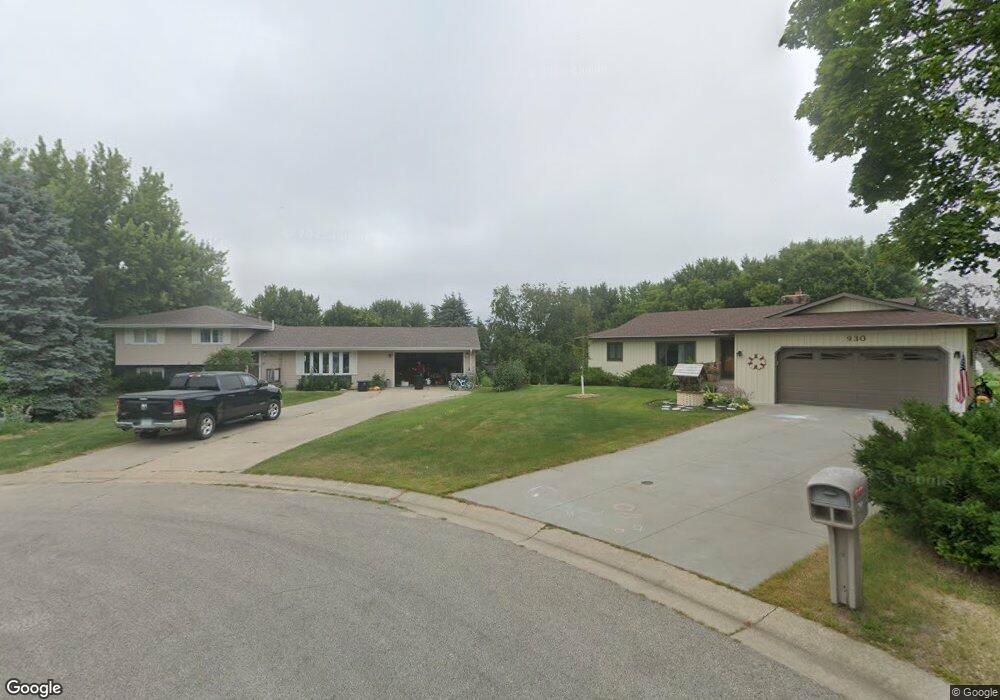
This home is located at 932 Rolling Heights Ct NE, Byron, MN 55920 and is currently estimated at $429,836, approximately $149 per square foot. 932 Rolling Heights Ct NE is a home located in Olmsted County with nearby schools including Byron Intermediate School, Byron Middle School, and Byron Senior High School.
Ownership History
Date
Name
Owned For
Owner Type
Purchase Details
Closed on
Nov 16, 2017
Sold by
Guerton Dustin Lee
Bought by
Thomas Kersten and Thomas Trevor
Current Estimated Value
Home Financials for this Owner
Home Financials are based on the most recent Mortgage that was taken out on this home.
Original Mortgage
$254,308
Outstanding Balance
$213,659
Interest Rate
3.95%
Mortgage Type
FHA
Estimated Equity
$216,177
Purchase Details
Closed on
Apr 9, 2015
Sold by
Guerton Nikki Ann
Bought by
Guerton Dustin Lee
Purchase Details
Closed on
Jul 23, 2010
Sold by
Magnus Bruce N and Magnus Kaye
Bought by
Guerton Dustin Lee and Guerton Nikki A
Home Financials for this Owner
Home Financials are based on the most recent Mortgage that was taken out on this home.
Original Mortgage
$217,098
Interest Rate
4.26%
Mortgage Type
New Conventional
Create a Home Valuation Report for This Property
The Home Valuation Report is an in-depth analysis detailing your home's value as well as a comparison with similar homes in the area
Home Values in the Area
Average Home Value in this Area
Purchase History
| Date | Buyer | Sale Price | Title Company |
|---|---|---|---|
| Thomas Kersten | $259,000 | Burnet Title | |
| Guerton Dustin Lee | -- | None Available | |
| Guerton Dustin Lee | $209,500 | Burnet Title Rochester |
Source: Public Records
Mortgage History
| Date | Status | Borrower | Loan Amount |
|---|---|---|---|
| Open | Thomas Kersten | $254,308 | |
| Previous Owner | Guerton Dustin Lee | $217,098 |
Source: Public Records
Tax History
| Year | Tax Paid | Tax Assessment Tax Assessment Total Assessment is a certain percentage of the fair market value that is determined by local assessors to be the total taxable value of land and additions on the property. | Land | Improvement |
|---|---|---|---|---|
| 2024 | $5,910 | $377,000 | $60,000 | $317,000 |
| 2023 | $5,940 | $378,700 | $60,000 | $318,700 |
| 2022 | $5,394 | $352,800 | $60,000 | $292,800 |
| 2021 | $4,704 | $303,100 | $60,000 | $243,100 |
| 2020 | $4,480 | $283,600 | $60,000 | $223,600 |
| 2019 | $4,150 | $265,400 | $50,000 | $215,400 |
| 2018 | $3,412 | $248,600 | $45,000 | $203,600 |
| 2017 | $3,192 | $218,000 | $40,000 | $178,000 |
| 2016 | $2,860 | $180,000 | $27,100 | $152,900 |
| 2015 | $2,788 | $157,100 | $21,100 | $136,000 |
| 2014 | $2,482 | $159,100 | $21,200 | $137,900 |
| 2012 | -- | $153,300 | $21,048 | $132,252 |
Source: Public Records
Map
Nearby Homes
- 926 Byron Ave N
- 910 Byron Ave N
- 805 1st Ave NW
- 498 Somerby Pkwy NE
- 264 Somerby Pkwy NE
- 208 Somerby Pkwy NE
- 244 Somerby Pkwy NE
- 226 Somerby Pkwy NE
- 190 Somerby Pkwy NE
- 516 Somerby Pkwy NE
- 172 Somerby Pkwy NE
- 154 Somerby Pkwy NE
- 319 Somerby Pkwy NE
- 301 Somerby Pkwy NE
- 337 Somerby Pkwy NE
- 578 Somerby Pkwy NE
- 283 Somerby Pkwy NE
- 355 Somerby Pkwy NE
- 1404 Somerby Pkwy NE
- 1405 Somerby Pkwy NE
- 933 Rolling Heights Ct NE
- 930 Rolling Heights Ct NE
- 931 Rolling Heights Ct NE
- 928 Rolling Heights Ct NE
- 929 Rolling Heights Ct NE
- 1011 2nd Ave NE
- 946 Byron Ave N
- 926 Rolling Heights Ct NE
- 1013 2nd Ave NE
- 1244 Brookfield Ct NE
- 1240 Brookfield Ct NE
- 1248 Brookfield Ct NE
- 925 Rolling Heights Ct NE
- 934 Byron Ave N
- 1007 2nd Ave NE
- 1256 Brookfield Ct NE
- 1252 Brookfield Ct NE
- 948 Byron Ave N
- 930 Byron Ave N
- 1236 Brookfield Ct NE
Your Personal Tour Guide
Ask me questions while you tour the home.