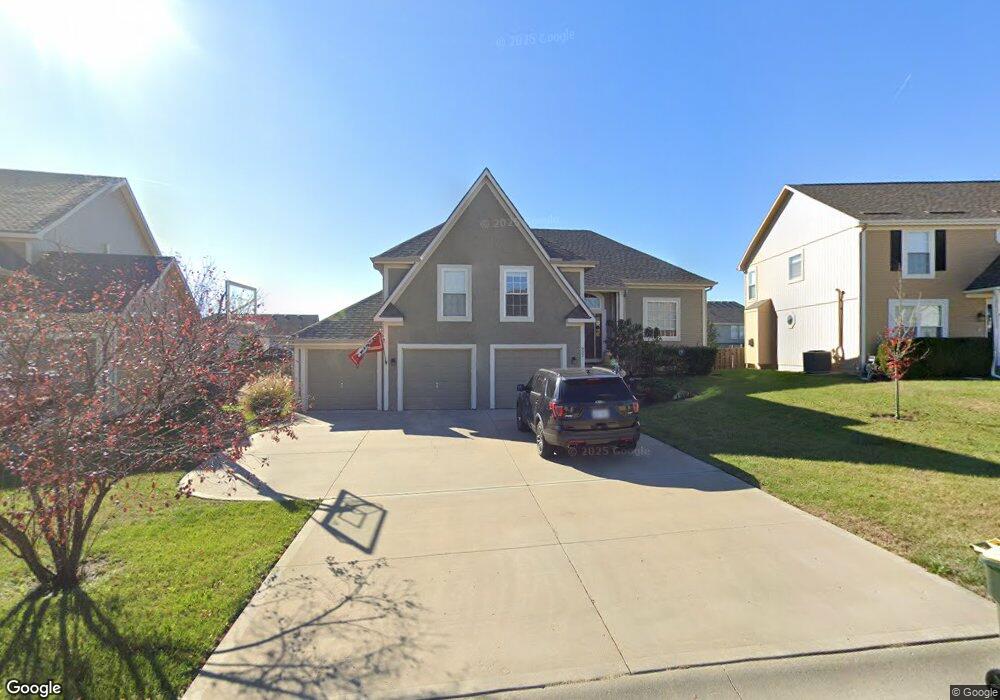
932 Southfork St Lansing, KS 66043
Estimated Value: $375,000 - $390,297
5
Beds
3
Baths
1,699
Sq Ft
$227/Sq Ft
Est. Value
About This Home
This home is located at 932 Southfork St, Lansing, KS 66043 and is currently estimated at $385,074, approximately $226 per square foot. 932 Southfork St is a home located in Leavenworth County with nearby schools including Lansing Elementary School, Lansing Middle 6-8, and Lansing High 9-12.
Ownership History
Date
Name
Owned For
Owner Type
Purchase Details
Closed on
Sep 10, 2020
Sold by
Moya Ricardo and Moya Joan L
Bought by
Fisackerly Nancy Marie and Ling Kenneth John
Current Estimated Value
Home Financials for this Owner
Home Financials are based on the most recent Mortgage that was taken out on this home.
Original Mortgage
$265,109
Outstanding Balance
$235,267
Interest Rate
2.9%
Mortgage Type
FHA
Estimated Equity
$149,807
Purchase Details
Closed on
Mar 23, 2006
Sold by
R & R Builders Inc
Bought by
Moya Ricardo and Moya Joan L
Create a Home Valuation Report for This Property
The Home Valuation Report is an in-depth analysis detailing your home's value as well as a comparison with similar homes in the area
Home Values in the Area
Average Home Value in this Area
Purchase History
| Date | Buyer | Sale Price | Title Company |
|---|---|---|---|
| Fisackerly Nancy Marie | -- | New Title Company Name | |
| Moya Ricardo | $208,740 | -- |
Source: Public Records
Mortgage History
| Date | Status | Borrower | Loan Amount |
|---|---|---|---|
| Open | Fisackerly Nancy Marie | $265,109 |
Source: Public Records
Tax History Compared to Growth
Tax History
| Year | Tax Paid | Tax Assessment Tax Assessment Total Assessment is a certain percentage of the fair market value that is determined by local assessors to be the total taxable value of land and additions on the property. | Land | Improvement |
|---|---|---|---|---|
| 2025 | $5,305 | $40,936 | $5,492 | $35,444 |
| 2024 | $4,920 | $39,362 | $5,492 | $33,870 |
| 2023 | $4,920 | $37,848 | $5,492 | $32,356 |
| 2022 | $4,731 | $34,408 | $3,574 | $30,834 |
| 2021 | $4,559 | $31,648 | $3,574 | $28,074 |
| 2020 | $4,342 | $29,670 | $3,574 | $26,096 |
| 2019 | $4,222 | $28,819 | $3,574 | $25,245 |
| 2018 | $3,874 | $26,479 | $3,574 | $22,905 |
| 2017 | $3,599 | $24,566 | $3,574 | $20,992 |
| 2016 | $3,564 | $24,322 | $3,574 | $20,748 |
| 2015 | $3,663 | $25,058 | $3,574 | $21,484 |
| 2014 | $3,587 | $25,058 | $3,574 | $21,484 |
Source: Public Records
Map
Nearby Homes
- 922 Southfork St
- 722 Bittersweet Rd
- 115 W Gilman Rd
- 811 4-H Rd
- 624 S Bittersweet Ln
- 901 S Main St
- 527 S Valley Dr
- 000 4-H Rd
- 1217 S Desoto Rd
- 875 Clearview Dr
- 131 Rock Creek Loop
- 1221 S Desoto Rd
- 705 Rock Creek Dr
- 833 Rock Creek Dr
- 506 1st Terrace
- 513 Forestglen Ln
- 202 S Main St
- 124 S Main St
- 73 Continental Dr
- 77 Continental Dr
- 930 Southfork St
- 934 Southfork St
- 1053 Wyndham Dr
- 1057 Wyndham Dr
- 928 Southfork St
- 1051 Wyndham Dr
- 929 Southfork St
- 931 Southfork St
- 935 Wyndham Dr
- 926 Southfork St
- 1043 Allyssa Ct
- 933 Wyndham Dr
- 1045 Allyssa Ct
- 1041 Allyssa Ct
- 1047 Allyssa Ct
- 917 Allyssa Ct
- 924 Southfork St
- 931 Wyndham Dr
- 925 Southfork St
- 1054 Wyndham Dr