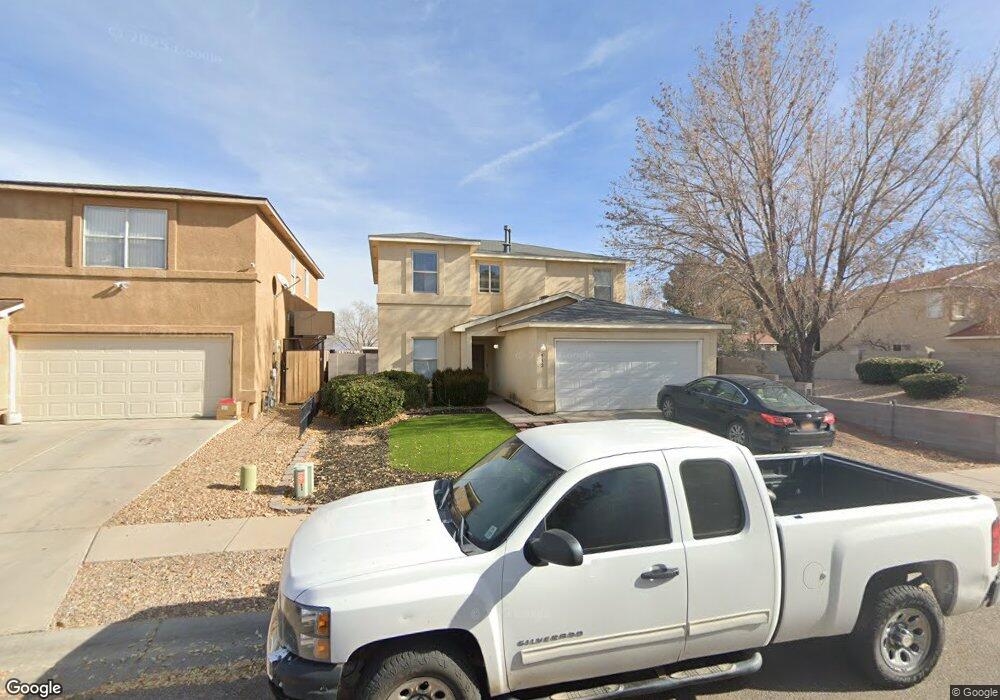
932 Swallow Dr SW Albuquerque, NM 87121
Southwest Heights NeighborhoodEstimated Value: $311,000 - $358,000
4
Beds
3
Baths
2,108
Sq Ft
$157/Sq Ft
Est. Value
About This Home
This home is located at 932 Swallow Dr SW, Albuquerque, NM 87121 and is currently estimated at $330,005, approximately $156 per square foot. 932 Swallow Dr SW is a home located in Bernalillo County with nearby schools including Carlos Rey Elementary School, Tony Hillerman Middle School, and Atrisco Heritage Academy High School.
Ownership History
Date
Name
Owned For
Owner Type
Purchase Details
Closed on
Sep 17, 2009
Sold by
Cartus Financial Corporation
Bought by
Pimentel Ernesto and Cisneros Edith
Current Estimated Value
Home Financials for this Owner
Home Financials are based on the most recent Mortgage that was taken out on this home.
Original Mortgage
$147,283
Interest Rate
5.5%
Mortgage Type
FHA
Purchase Details
Closed on
Aug 4, 2009
Sold by
Patel Jayesh V and Patel Minal J
Bought by
Cartus Financial Corporation
Home Financials for this Owner
Home Financials are based on the most recent Mortgage that was taken out on this home.
Original Mortgage
$147,283
Interest Rate
5.5%
Mortgage Type
FHA
Purchase Details
Closed on
Aug 9, 1999
Sold by
Centex Homes
Bought by
Patel Jayesh and Patel Minal J
Home Financials for this Owner
Home Financials are based on the most recent Mortgage that was taken out on this home.
Original Mortgage
$123,978
Interest Rate
7.63%
Mortgage Type
FHA
Create a Home Valuation Report for This Property
The Home Valuation Report is an in-depth analysis detailing your home's value as well as a comparison with similar homes in the area
Home Values in the Area
Average Home Value in this Area
Purchase History
| Date | Buyer | Sale Price | Title Company |
|---|---|---|---|
| Pimentel Ernesto | -- | Rio Grande Title Co Inc | |
| Cartus Financial Corporation | -- | Rio Grande Title Co Inc | |
| Patel Jayesh | -- | Stewart Title |
Source: Public Records
Mortgage History
| Date | Status | Borrower | Loan Amount |
|---|---|---|---|
| Previous Owner | Pimentel Ernesto | $147,283 | |
| Previous Owner | Patel Jayesh | $123,978 |
Source: Public Records
Tax History Compared to Growth
Tax History
| Year | Tax Paid | Tax Assessment Tax Assessment Total Assessment is a certain percentage of the fair market value that is determined by local assessors to be the total taxable value of land and additions on the property. | Land | Improvement |
|---|---|---|---|---|
| 2024 | $2,088 | $49,485 | $14,001 | $35,484 |
| 2023 | $2,053 | $48,045 | $13,594 | $34,451 |
| 2022 | $1,984 | $46,646 | $13,198 | $33,448 |
| 2021 | $1,917 | $45,288 | $12,814 | $32,474 |
| 2020 | $1,886 | $43,970 | $12,441 | $31,529 |
| 2019 | $1,831 | $42,688 | $12,078 | $30,610 |
| 2018 | $1,766 | $42,688 | $12,078 | $30,610 |
| 2017 | $1,711 | $41,446 | $11,727 | $29,719 |
| 2016 | $1,662 | $39,067 | $11,054 | $28,013 |
| 2015 | $37,929 | $37,929 | $10,732 | $27,197 |
| 2014 | $1,623 | $38,229 | $10,732 | $27,497 |
| 2013 | -- | $38,229 | $10,732 | $27,497 |
Source: Public Records
Map
Nearby Homes
- 10316 Andalusian Ave SW
- 10409 Red Robin Rd SW
- 919 Crane Dr SW
- 10312 Cornelia Ct SW
- 805 Malachite Dr SW
- 10504 Connemara Dr SW
- 1111 Carla St SW
- 9736 Westbound Ave SW
- 11001 Paso Fino Ave SW
- 11004 Teal Rd SW
- 632 Foyt Dr SW
- 9620 Sage Ranch Ct
- 1309 Canyon Trail SW
- 9609 Sage Ranch Ct SW
- 11015 Connemara Dr SW
- 9616 Sage Ranch Ct SW
- 10622 Benavides Rd SW
- 9600 Sage Ranch Ct
- 9900 Ladder Ranch Ln SW
- 9504 Sage Ranch Ct
- 928 Swallow Dr SW
- 924 Swallow Dr SW
- 920 Swallow Dr SW
- 1000 Swallow Dr SW
- 931 Pheasant Run Dr SW
- 935 Pheasant Run Dr SW
- 1004 Swallow Dr SW
- 916 Swallow Dr SW
- 1005 Pheasant Dr SW
- 927 Pheasant Run Dr SW
- 923 Pheasant Run Dr SW
- 1001 Swallow Dr SW
- 1001 Pheasant Run Dr SW
- 1005 Pheasant Run Dr SW
- 1008 Swallow Dr SW
- 1005 Swallow Dr SW
- 912 Swallow Dr SW
- 919 Swallow Dr SW
- 919 Pheasant Run Dr SW
- 1009 Pheasant Run Dr SW